Sub-Total: $0.00
Visualizing subgroups when searching for insights
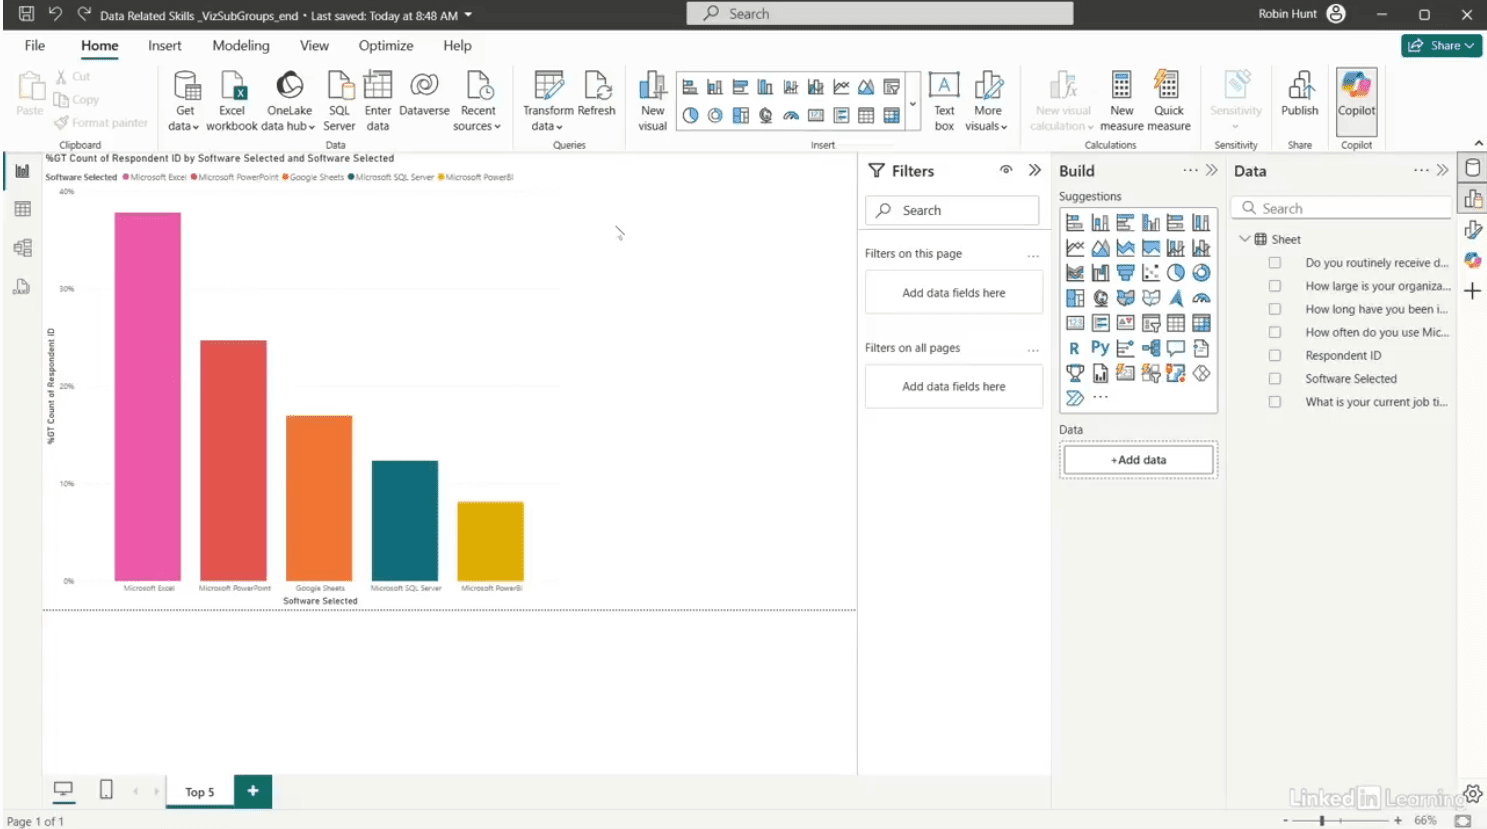
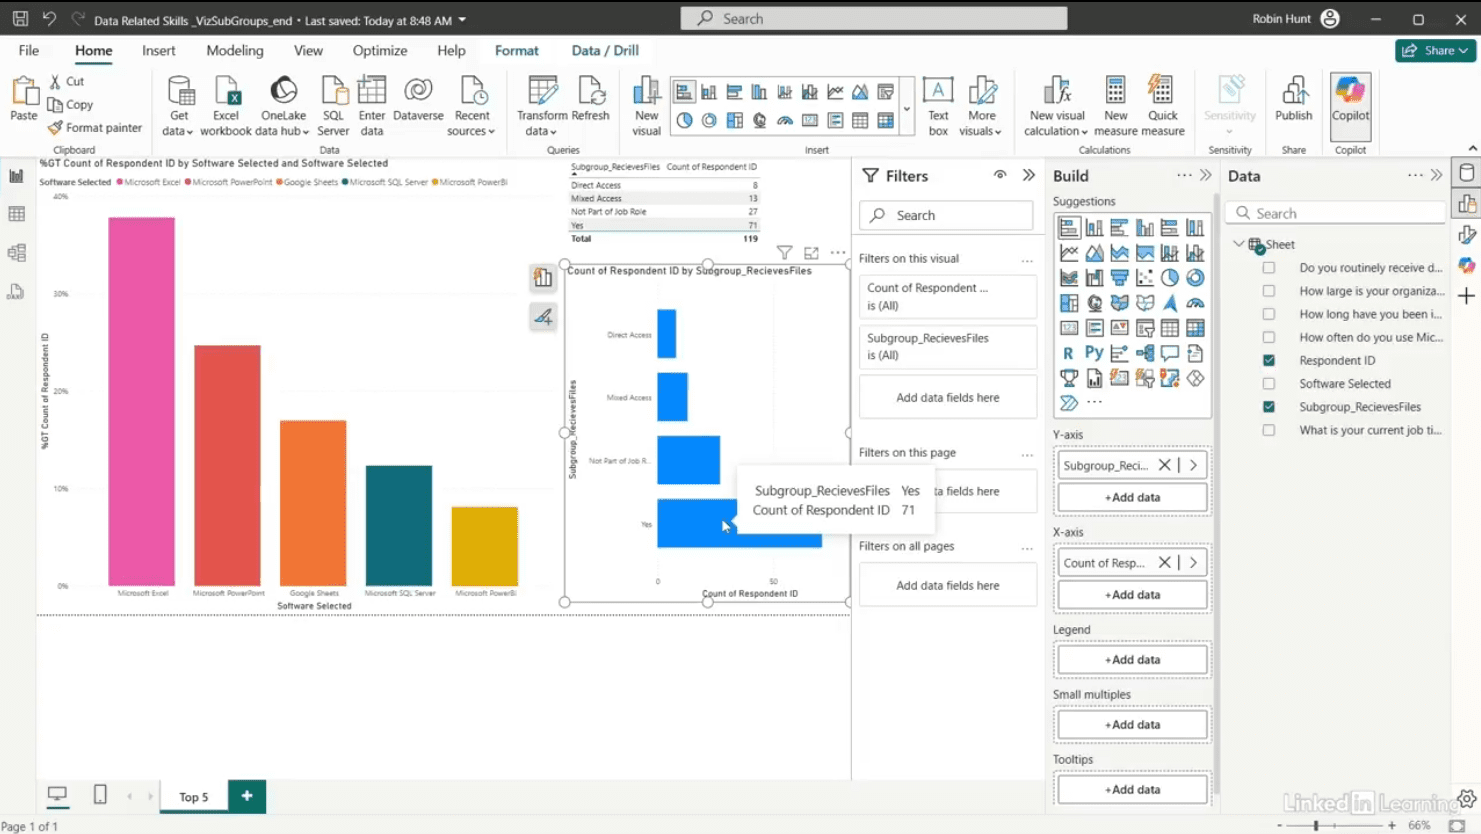
Learn how to uncover deeper insights by analyzing subgroups in your data. Demographics aren’t the only way to slice a dataset—sometimes the most meaningful patterns appear in behavioral subgroups. In this Data Survival Skills session, Robin shows how to clean and restructure survey responses to highlight groups based on how they receive data: direct access, mixed access, routine file recipients, or those for whom it’s not part of their role. By creating a new subgroup field in Power Query and applying distinct counts in Power BI, you’ll see how each group uses tools like Excel, Google Sheets, PowerPoint, SQL Server, and Power BI differently. These comparisons reveal unexpected trends—like high spreadsheet use even among those who don’t receive files, or rising SQL adoption in mixed-access users. By analyzing data at the subgroup level, you move beyond surface-level reporting and uncover insights that drive smarter decisions.
#PowerBI #ExcelTips #PowerQuery #DataAnalytics #BusinessIntelligence #SurveyAnalysis #DataVisualization #DataSkills #Productivity
If you’re a data analyst, you’ve no doubt learned different skills, techniques, and tools pertaining to data. But sometimes it can be difficult to know when and why to apply these tools. In this weekly series, instructor Robin Hunt explains a new skill, secret, tip, technique, best practice, or golden piece of advice in each installment. Robin covers topics that can help you do your job better, such as joining data and data designs, privacy for data, transforming and cleaning data, and making data sets and visualizing data.
Note: Because this is an ongoing series, viewers will not receive a certificate of completion.