Sub-Total: $0.00
Normalizing data to achieve a data design
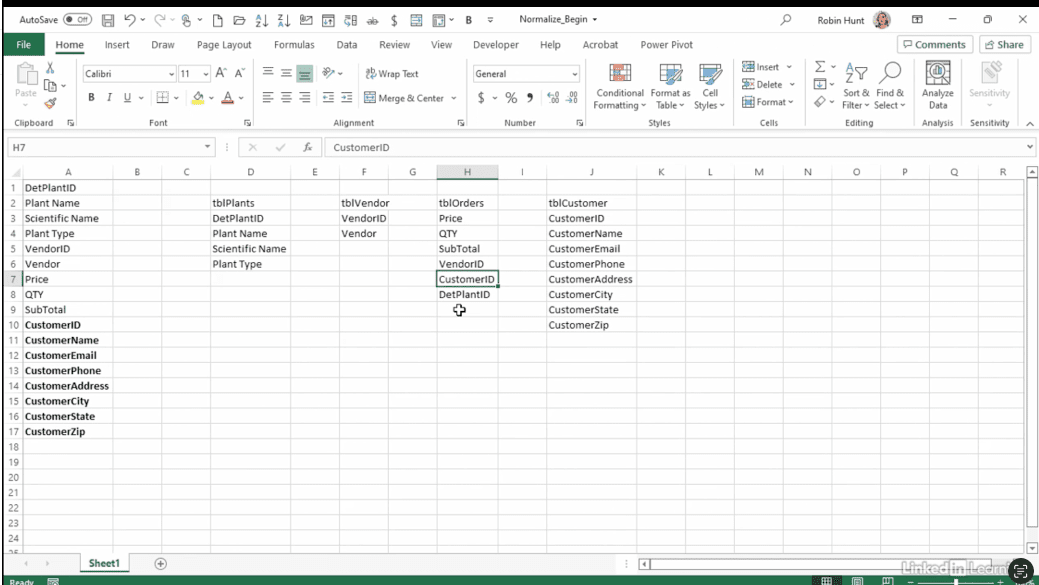
Learn how to break down combined datasets into clean, structured tables. In this Data Survival Skills session, Robin shows how to normalize data by separating information on plants, vendors, orders, and customers. By identifying relationships like one-to-many links and spotting missing fields such as order dates or IDs, she demonstrates how to model your data for better analysis, visualization, and reporting. This approach makes it easy to validate, clean, and refine your data—turning messy tables into actionable insights.
#DataNormalization #RelationalDatabases #DataModeling #PowerBI #Excel #DataCleaning #DataValidation #BusinessIntelligence #DataAnalysis #DatabaseDesign #DataVisualization

If you’re a data analyst, you’ve no doubt learned different skills, techniques, and tools pertaining to data. But sometimes it can be difficult to know when and why to apply these tools. In this weekly series, instructor Robin Hunt explains a new skill, secret, tip, technique, best practice, or golden piece of advice in each installment. Robin covers topics that can help you do your job better, such as joining data and data designs, privacy for data, transforming and cleaning data, and making data sets and visualizing data.
Note: Because this is an ongoing series, viewers will not receive a certificate of completion.