Sub-Total: $0.00
Build conditional functions to make data
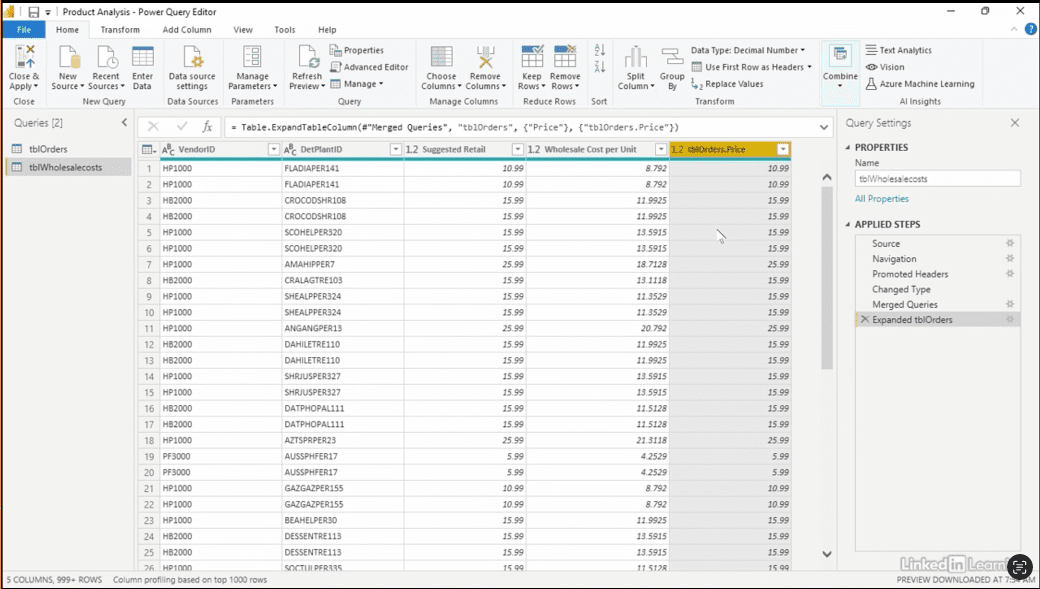
Learn how to create powerful insights from imperfect data by building conditional logic in Power BI. In this Data Survival Skills session, Robin demonstrates how to merge CSV and Excel sources, bringing together wholesale costs and order details into a unified dataset. By walking through step-by-step examples, she shows how to build conditional columns that flag products sold at, above, or below suggested retail, calculate price differences, and scale those differences across quantities sold. You’ll also see how to use filters and slicers to quickly measure gains and losses from pricing decisions, uncovering the real impact on revenue. This approach equips you to transform scattered data into meaningful analysis, helping you design smarter reports and make more informed business decisions.
#PowerQuery #PowerBI #Excel #DataCleaning #DataModeling #BusinessIntelligence #DataAnalytics #MicrosoftPowerBI


If you’re a data analyst, you’ve no doubt learned different skills, techniques, and tools pertaining to data. But sometimes it can be difficult to know when and why to apply these tools. In this weekly series, instructor Robin Hunt explains a new skill, secret, tip, technique, best practice, or golden piece of advice in each installment. Robin covers topics that can help you do your job better, such as joining data and data designs, privacy for data, transforming and cleaning data, and making data sets and visualizing data.
Note: Because this is an ongoing series, viewers will not receive a certificate of completion.