Sub-Total: $0.00
Building Date Tables in Power BI/Power Query
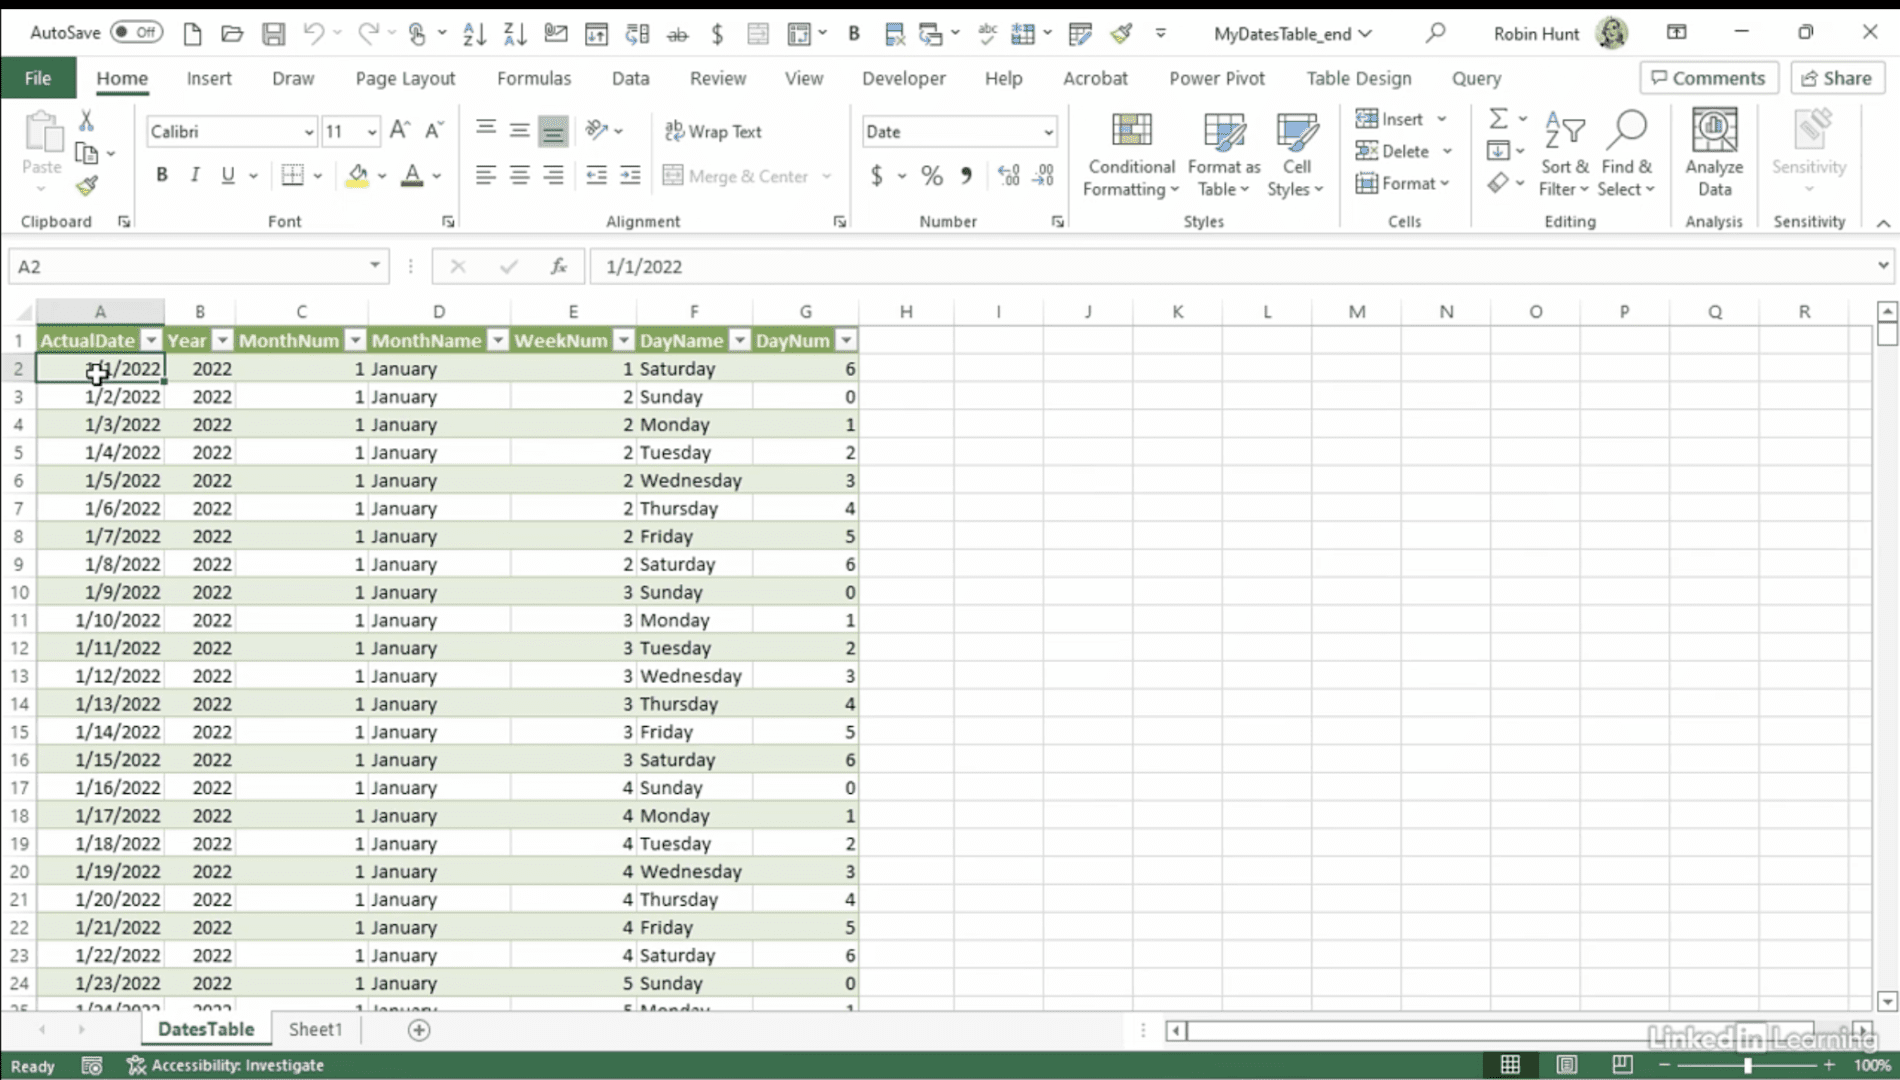
Learn how to streamline time-based analysis by building a reusable date table in Power Query. In this Data Survival Skills session, Robin starts with a blank query and uses a custom function to generate a continuous range of dates. She then normalizes the table by adding key attributes such as month name, month number, weekday, week of year, and end-of-month. You’ll also see how to copy the advanced editor code into any workbook, making the date table easy to reuse across multiple projects. Finally, Robin connects the date table to sales data, instantly enriching reports with fields like order month, week number, and day name—without writing extra formulas. This approach reduces repetition, ensures consistency, and gives analysts a powerful foundation for reporting and trend analysis.
#PowerQuery #PowerBI #Excel #DateTable #DataModeling #DataAutomation #BusinessIntelligence #DataAnalytics


If you’re a data analyst, you’ve no doubt learned different skills, techniques, and tools pertaining to data. But sometimes it can be difficult to know when and why to apply these tools. In this weekly series, instructor Robin Hunt explains a new skill, secret, tip, technique, best practice, or golden piece of advice in each installment. Robin covers topics that can help you do your job better, such as joining data and data designs, privacy for data, transforming and cleaning data, and making data sets and visualizing data.
Note: Because this is an ongoing series, viewers will not receive a certificate of completion.