Sub-Total: $0.00
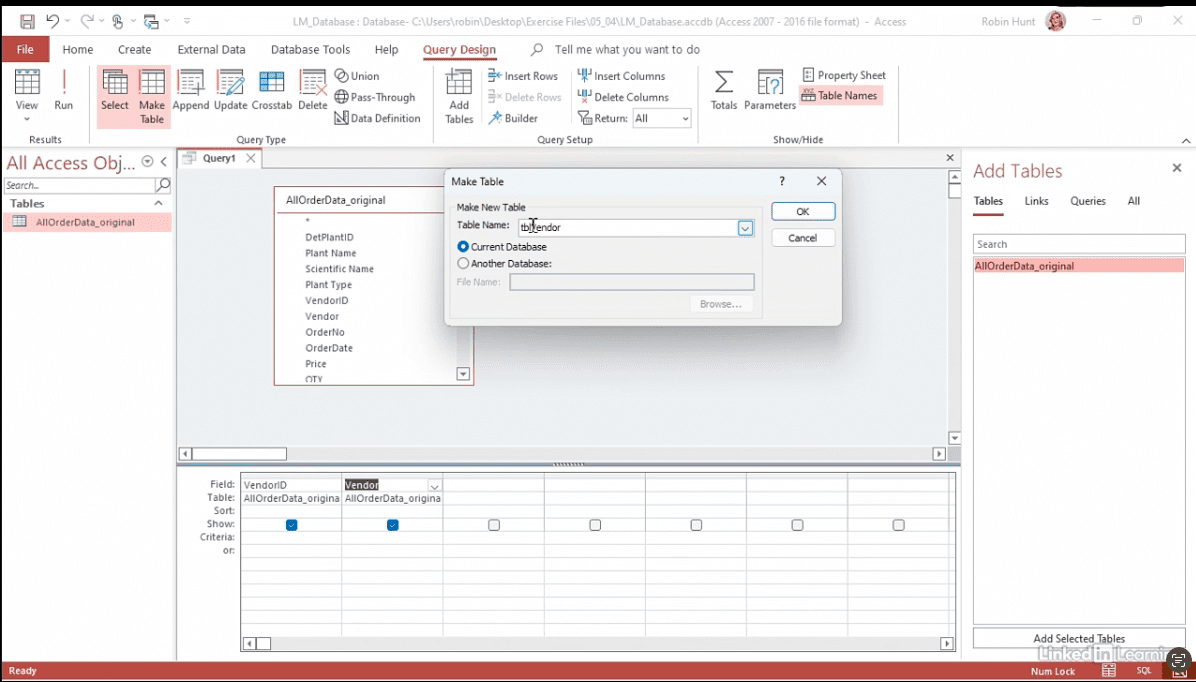
Using Make Tables to normalize a denormalized data set
Discover how to turn messy spreadsheets into an organized, normalized database with Microsoft Access. In this Data Survival Skills session, Robin takes Leaf & Mortar’s order and customer list and shows how to make it easier to manage. She starts by importing a CSV file, then uses simple queries to pull out unique values and create new tables for vendors, plants, clients, and order details. You’ll also learn how to add IDs (primary keys) and connect the tables together so the data links up properly. By the end, you’ll see how breaking one big sheet into smaller, connected tables helps normalize your data—reducing repetition, improving accuracy, and making everything easier to update, analyze, and share.
#MicrosoftAccess #DataModeling #DataCleaning #DatabaseDesign #DataAnalytics #BusinessIntelligence


If you’re a data analyst, you’ve no doubt learned different skills, techniques, and tools pertaining to data. But sometimes it can be difficult to know when and why to apply these tools. In this weekly series, instructor Robin Hunt explains a new skill, secret, tip, technique, best practice, or golden piece of advice in each installment. Robin covers topics that can help you do your job better, such as joining data and data designs, privacy for data, transforming and cleaning data, and making data sets and visualizing data.
Note: Because this is an ongoing series, viewers will not receive a certificate of completion.