Sub-Total: $0.00
Using analysis commands built into Popular Tools
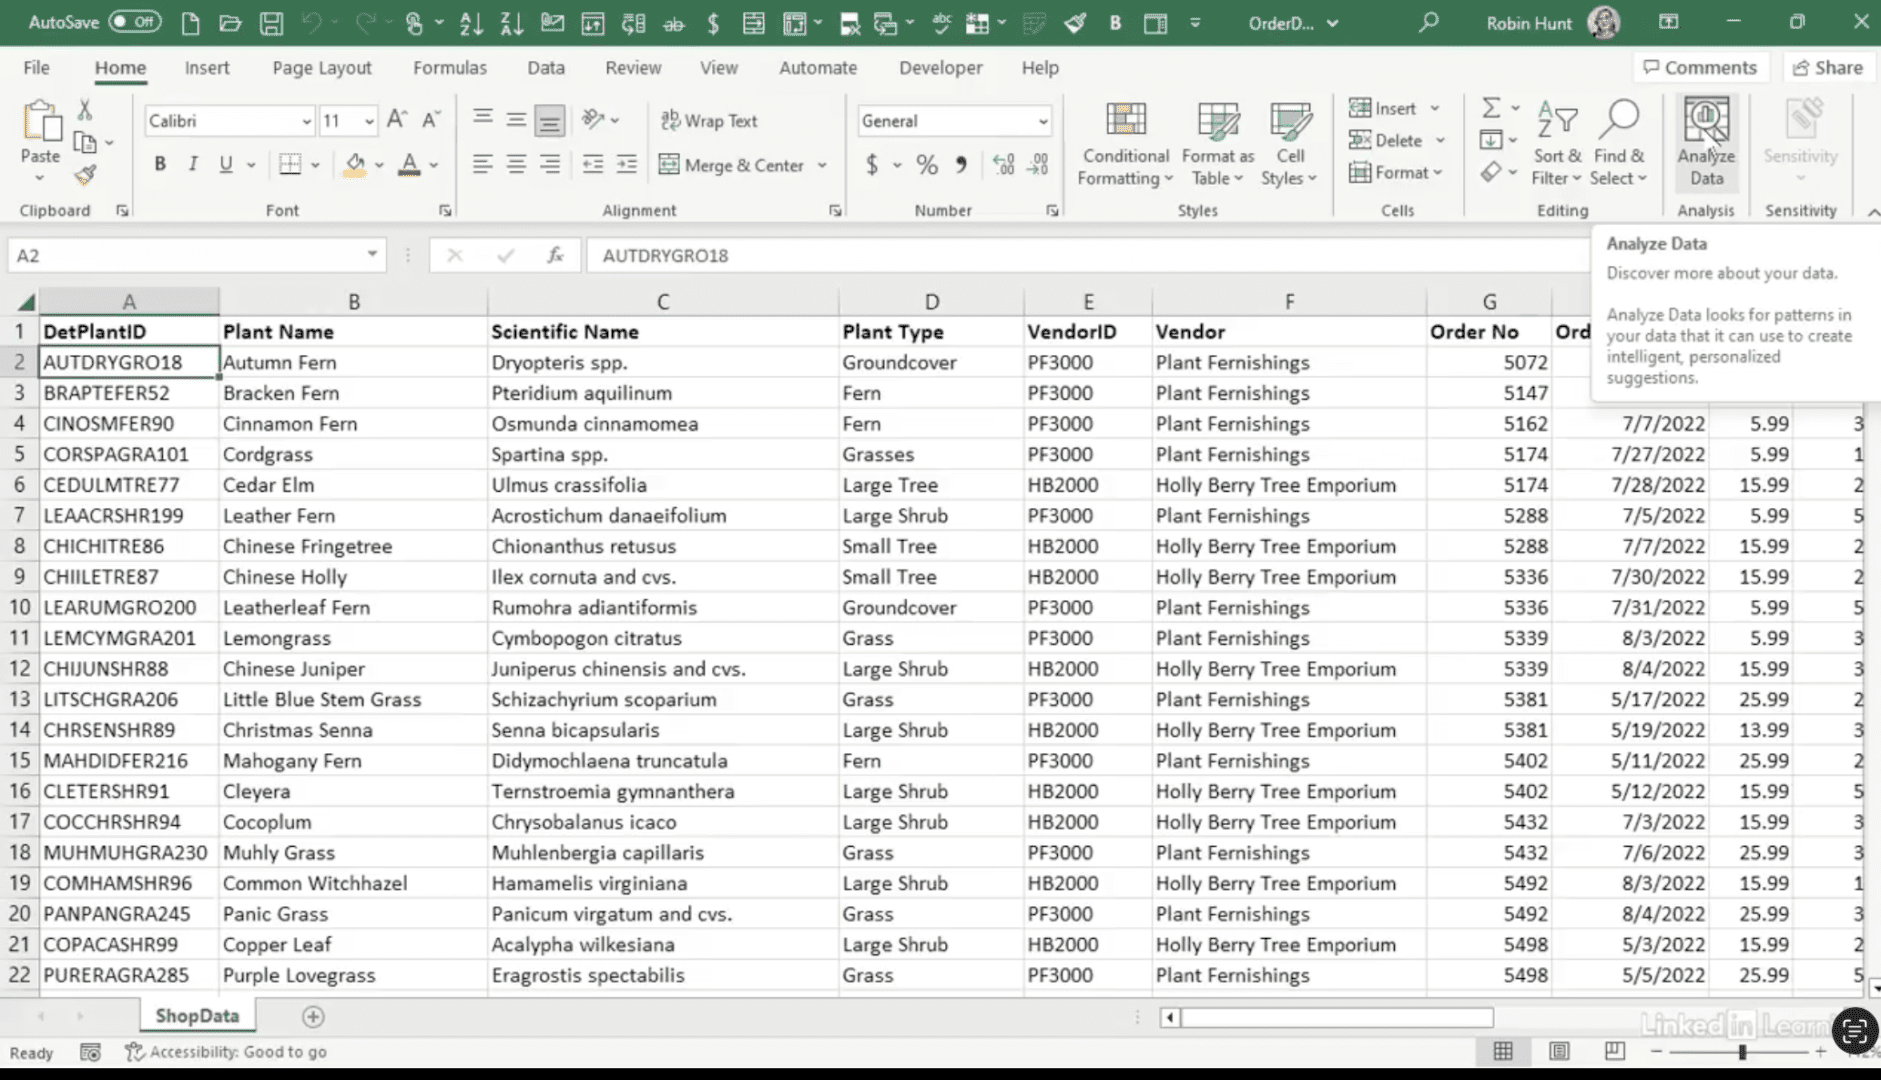
Discover the power of built-in analysis tools. Most modern data tools—including Excel—come with analysis features that can uncover insights quickly, no coding required. In this Data Survival Skills session, Robin demonstrates how to clean and prepare data in Power Query, then use Excel’s Analyze Data feature to surface patterns, correlations, and trends instantly. She also introduces the Analysis ToolPak, which expands Excel’s statistical capabilities to include descriptive statistics and more advanced tests. Whether you’re looking for quick insights or deeper analysis, learning to harness these built-in tools helps you save time, make smarter decisions, and get more value from your datasets.
#DataAnalytics #ExcelTips #PowerQuery #BusinessIntelligence #DataSkills #Productivity #AnalysisTools #Statistics #DataCleaning #DataAnalysis


If you’re a data analyst, you’ve no doubt learned different skills, techniques, and tools pertaining to data. But sometimes it can be difficult to know when and why to apply these tools. In this weekly series, instructor Robin Hunt explains a new skill, secret, tip, technique, best practice, or golden piece of advice in each installment. Robin covers topics that can help you do your job better, such as joining data and data designs, privacy for data, transforming and cleaning data, and making data sets and visualizing data.
Note: Because this is an ongoing series, viewers will not receive a certificate of completion.