Sub-Total: $0.00
Perform basic analysis on Datasets
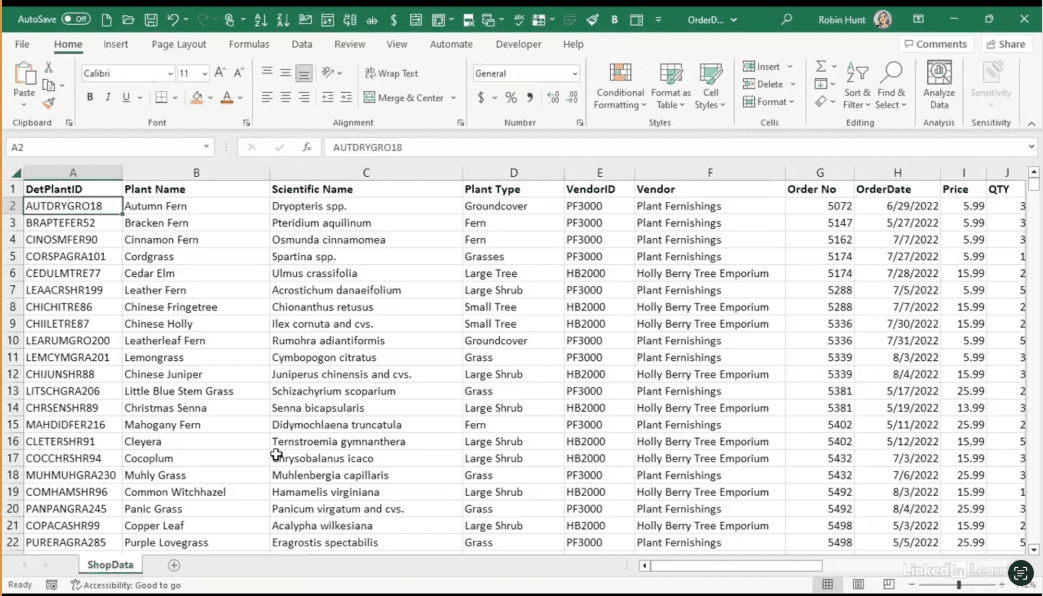
Learn how to perform basic analysis on datasets. Every dataset has a story—and it often starts with the mean, median, and mode. In this Data Survival Skills session, Robin shows how to use Power Query and Excel to clean data, standardize fields, and calculate averages that reveal meaningful insights. You’ll learn how to transform messy values, group data by categories like plant type or state, and compare averages across subsets of your dataset. By mastering these simple techniques, you’ll not only spot trends faster but also set a foundation for deeper analysis. This approach goes beyond raw numbers—it helps you monitor patterns, identify differences, and keep your data ready for decision-making.
#DataAnalytics #ExcelTips #PowerQuery #DataAnalysis #BusinessIntelligence #DataCleaning #DataSkills #Productivity #CentralTendency #ExploratoryAnalysis


If you’re a data analyst, you’ve no doubt learned different skills, techniques, and tools pertaining to data. But sometimes it can be difficult to know when and why to apply these tools. In this weekly series, instructor Robin Hunt explains a new skill, secret, tip, technique, best practice, or golden piece of advice in each installment. Robin covers topics that can help you do your job better, such as joining data and data designs, privacy for data, transforming and cleaning data, and making data sets and visualizing data.
Note: Because this is an ongoing series, viewers will not receive a certificate of completion.