Sub-Total: $0.00
Analyzing top and bottom scenarios
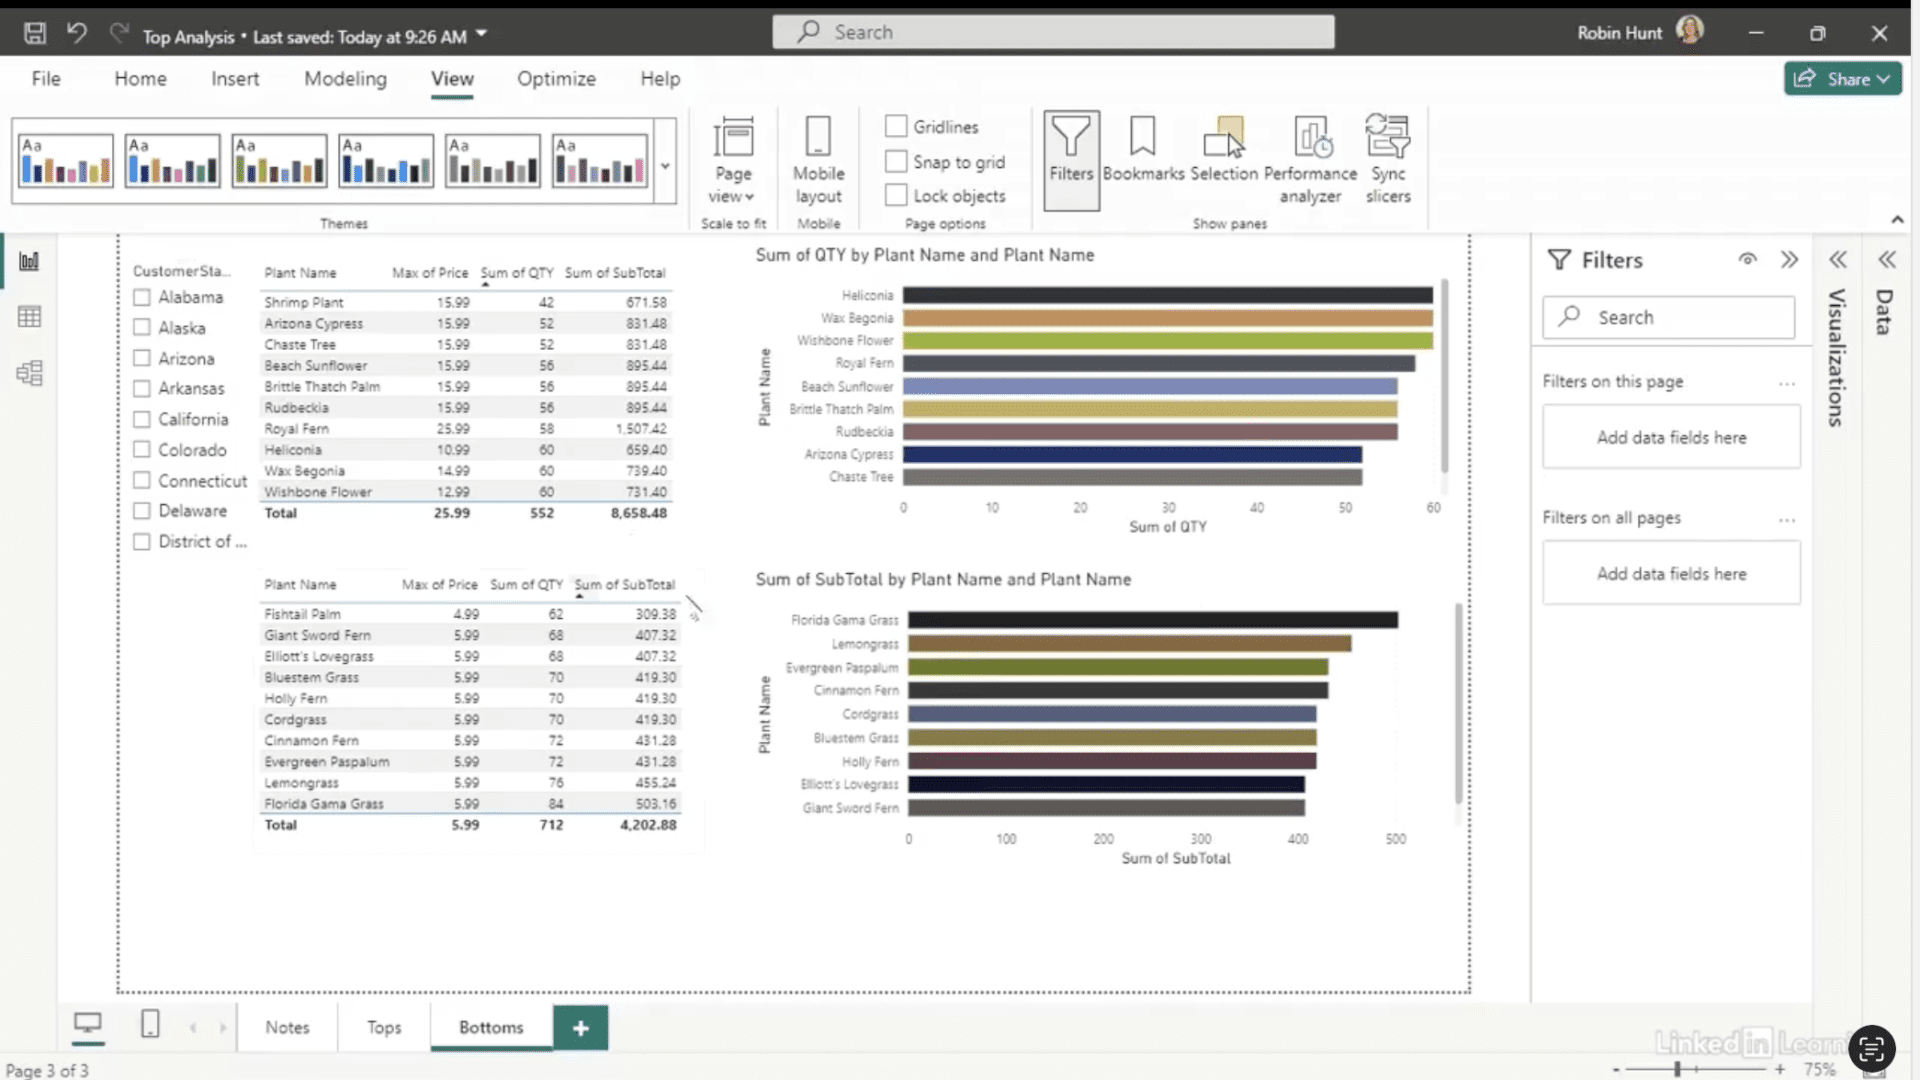
Learn how to study the top and bottom of your dataset with Power BI. Full datasets are valuable, but sometimes the biggest insights come from just the highest- or lowest-performing records. In this Data Survival Skills session, Robin shows how to start with context—record counts, totals, clients, and date ranges—so your audience understands the data before diving in. You’ll learn how to filter for the top 10 products by sales or quantity, duplicate visuals to flip from “top” to “bottom” analysis, and add slicers to see how results vary across customers or regions. By comparing both ends of the dataset, you can uncover where value is created, where it’s lost, and how to make smarter business decisions.
#DataAnalytics #PowerBI #DataVisualization #BusinessIntelligence #ExploratoryAnalysis #DataSkills #Productivity
If you’re a data analyst, you’ve no doubt learned different skills, techniques, and tools pertaining to data. But sometimes it can be difficult to know when and why to apply these tools. In this weekly series, instructor Robin Hunt explains a new skill, secret, tip, technique, best practice, or golden piece of advice in each installment. Robin covers topics that can help you do your job better, such as joining data and data designs, privacy for data, transforming and cleaning data, and making data sets and visualizing data.
Note: Because this is an ongoing series, viewers will not receive a certificate of completion.