Sub-Total: $0.00
Build paginated reports
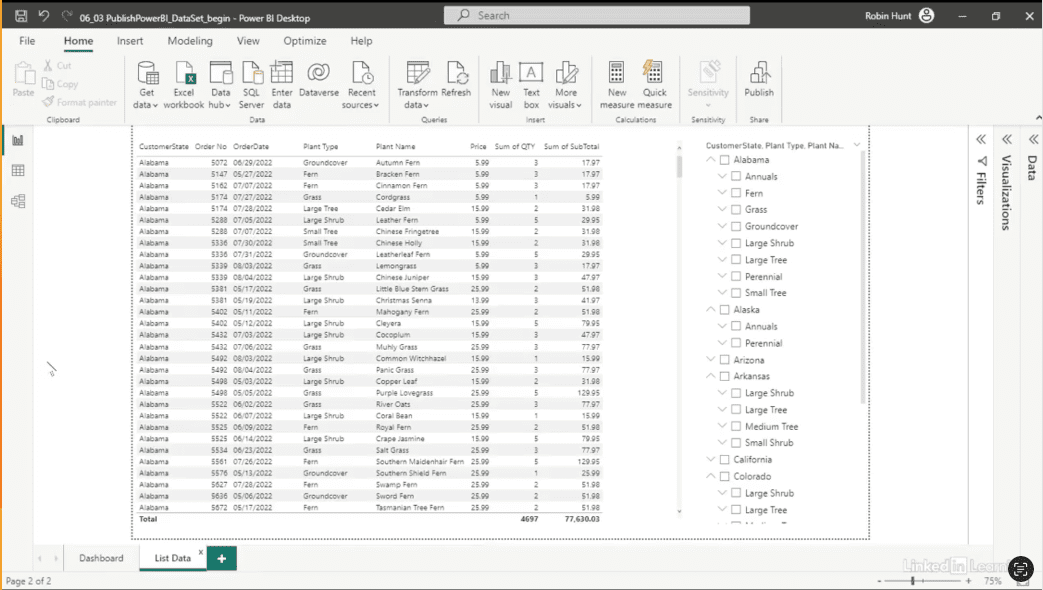
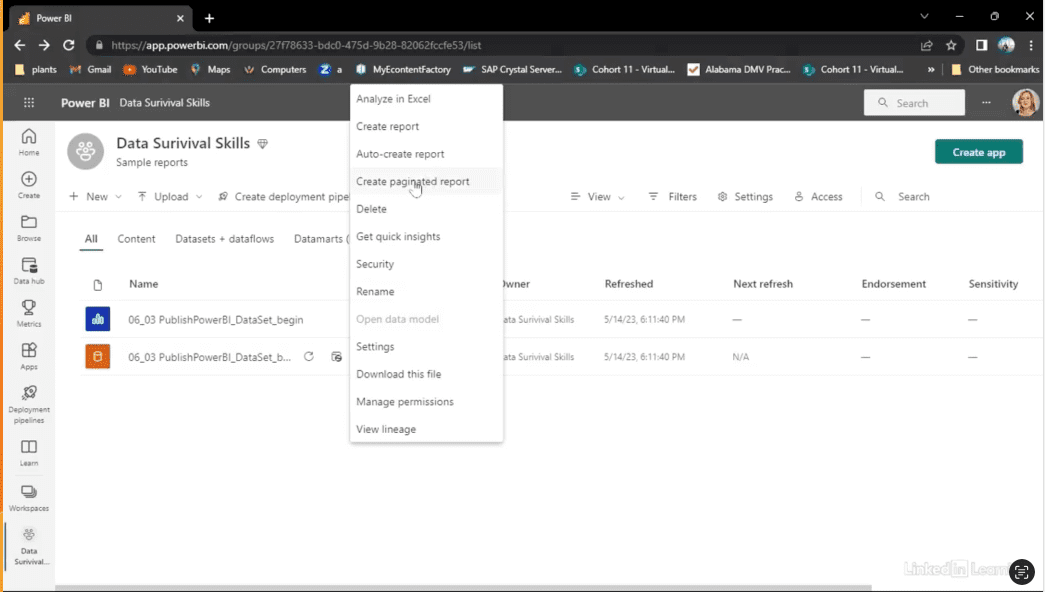
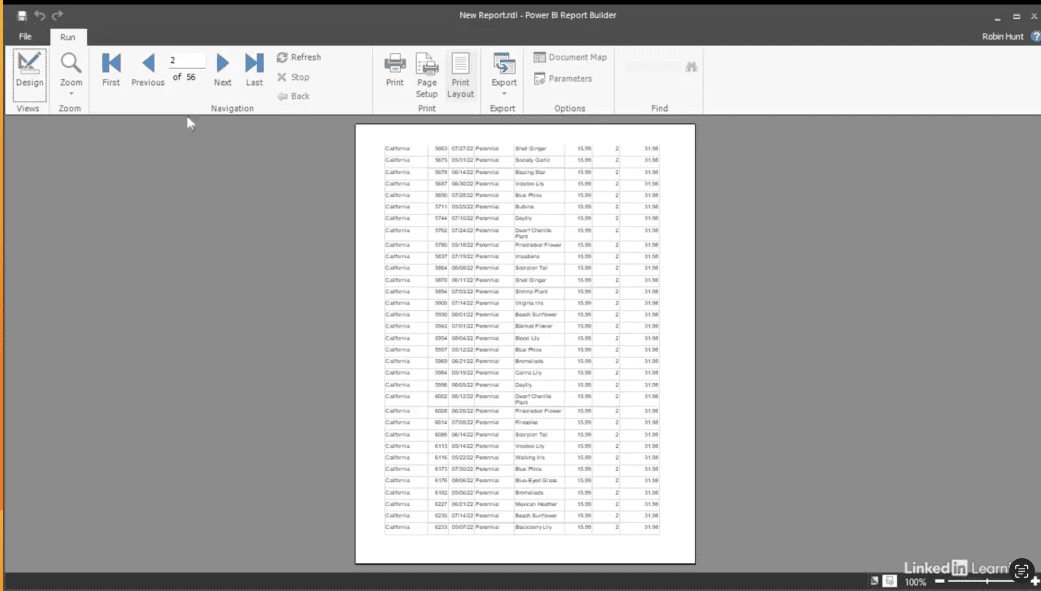
Learn how to build paginated reports that scale with your data. Dashboards are great for visual exploration, but when you need detailed, multi-page printouts, paginated reports are essential. In this Data Survival Skills session, Robin demonstrates how to leverage a single Power BI dataset to create reports that are both printable and interactive. You'll learn how to set up datasets, design tables, format visuals for print, and publish reports to a shared workspace. By using paginated reports, you ensure every user has access to clean, consistent data—whether on screen or on paper—without duplicating effort. This approach goes beyond basic reporting—it keeps your data accurate, your processes efficient, and your team productive.
#DataAnalytics #PaginatedReports #PowerBI #BusinessIntelligence #DataVisualization #WorkflowOptimization #ReportDesign #UserExperience #Productivity
If you’re a data analyst, you’ve no doubt learned different skills, techniques, and tools pertaining to data. But sometimes it can be difficult to know when and why to apply these tools. In this weekly series, instructor Robin Hunt explains a new skill, secret, tip, technique, best practice, or golden piece of advice in each installment. Robin covers topics that can help you do your job better, such as joining data and data designs, privacy for data, transforming and cleaning data, and making data sets and visualizing data.
Note: Because this is an ongoing series, viewers will not receive a certificate of completion.