Sub-Total: $0.00
Build letter size for reports using Power BI Desktop
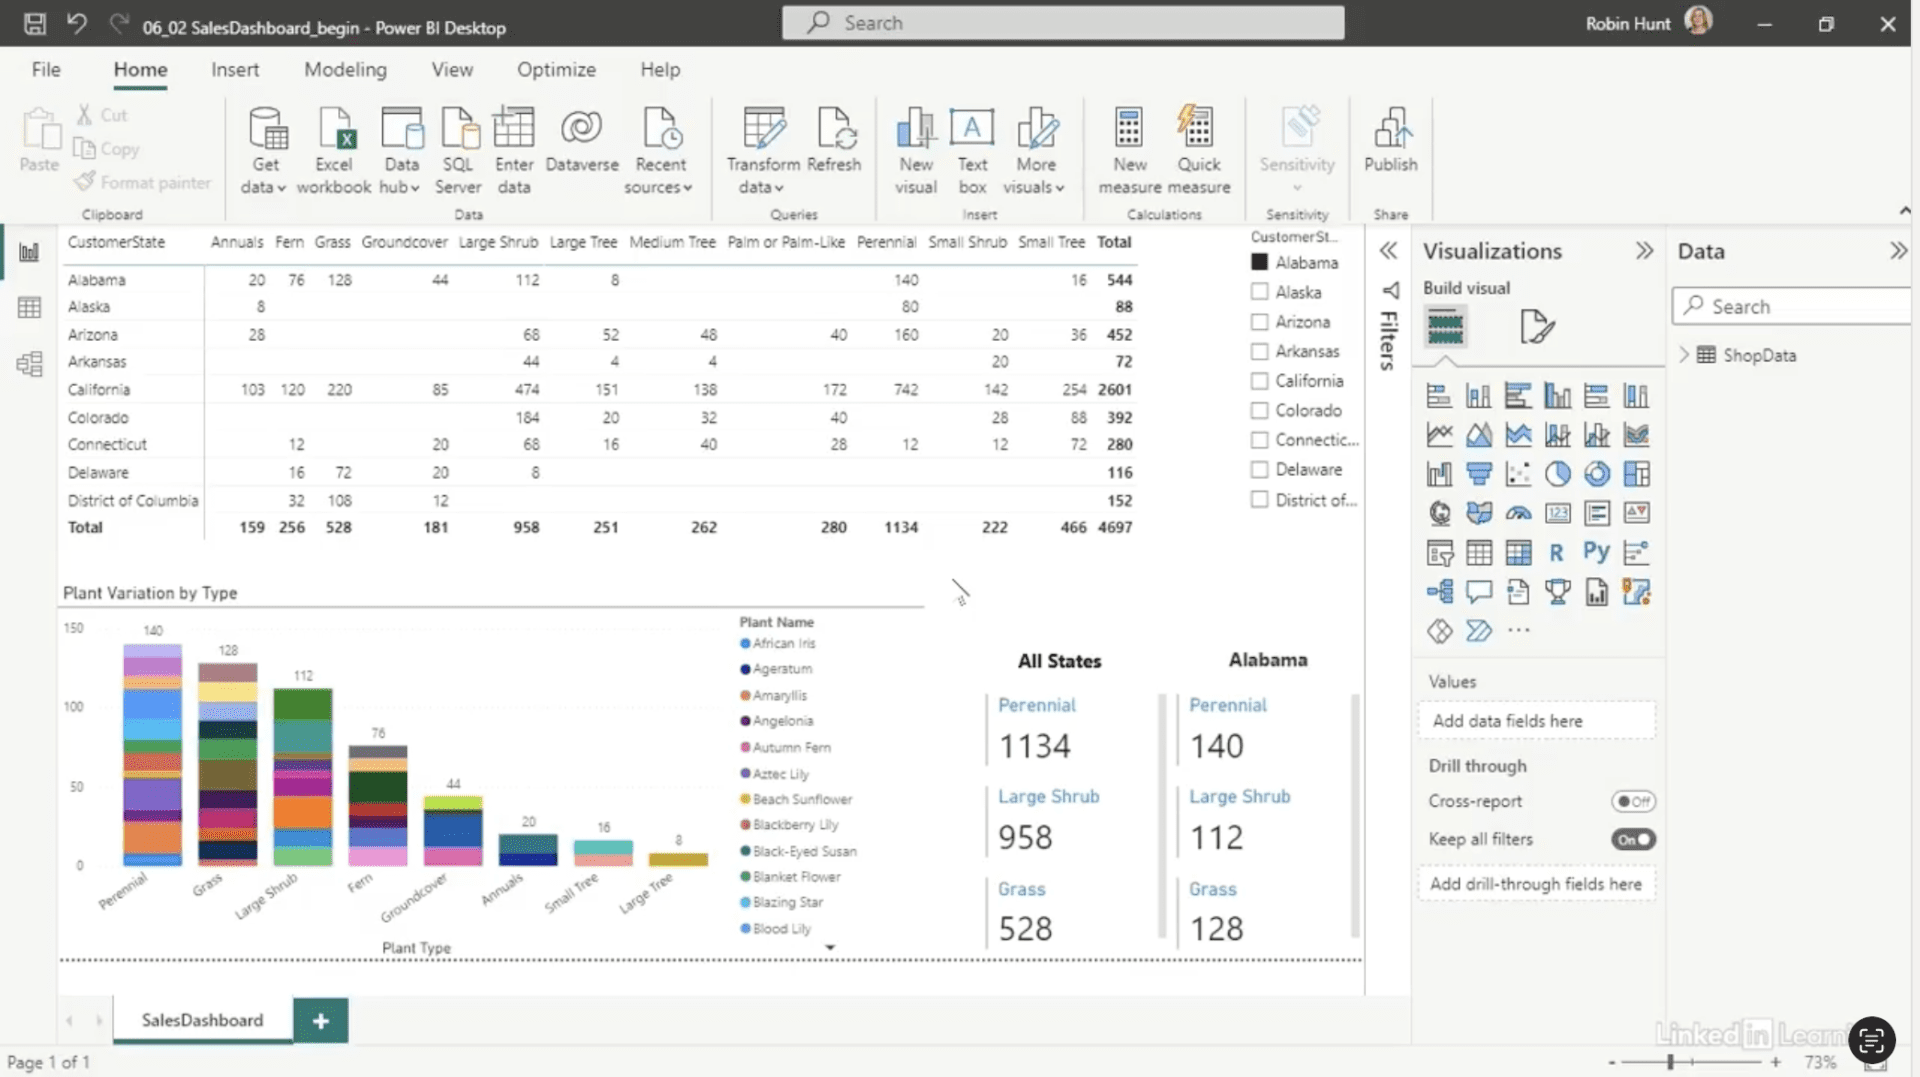
Learn how to create print-ready, state-specific reports in Power BI.
Printed reports are still essential for executive meetings, but recreating dashboards for print can be time-consuming. In this Data Survival Skills session, Robin demonstrates how to duplicate dashboard pages, adjust visuals for letter-size portrait layouts, and add summary cards that show totals and distinct counts. By setting up each page carefully, you maintain consistency with your existing dashboards while producing clear, executive-ready reports. This method goes beyond simply exporting data—it ensures every page is properly formatted, readable, and actionable, saving time and preventing errors.
#DataAnalytics #ReportDesign #PowerBI #BusinessIntelligence #DataVisualization #WorkflowOptimization #ExecutiveReports #DashboardEfficiency #UserExperience

If you’re a data analyst, you’ve no doubt learned different skills, techniques, and tools pertaining to data. But sometimes it can be difficult to know when and why to apply these tools. In this weekly series, instructor Robin Hunt explains a new skill, secret, tip, technique, best practice, or golden piece of advice in each installment. Robin covers topics that can help you do your job better, such as joining data and data designs, privacy for data, transforming and cleaning data, and making data sets and visualizing data.
Note: Because this is an ongoing series, viewers will not receive a certificate of completion.