Sub-Total: $0.00
Visualizing data sets in Outlook
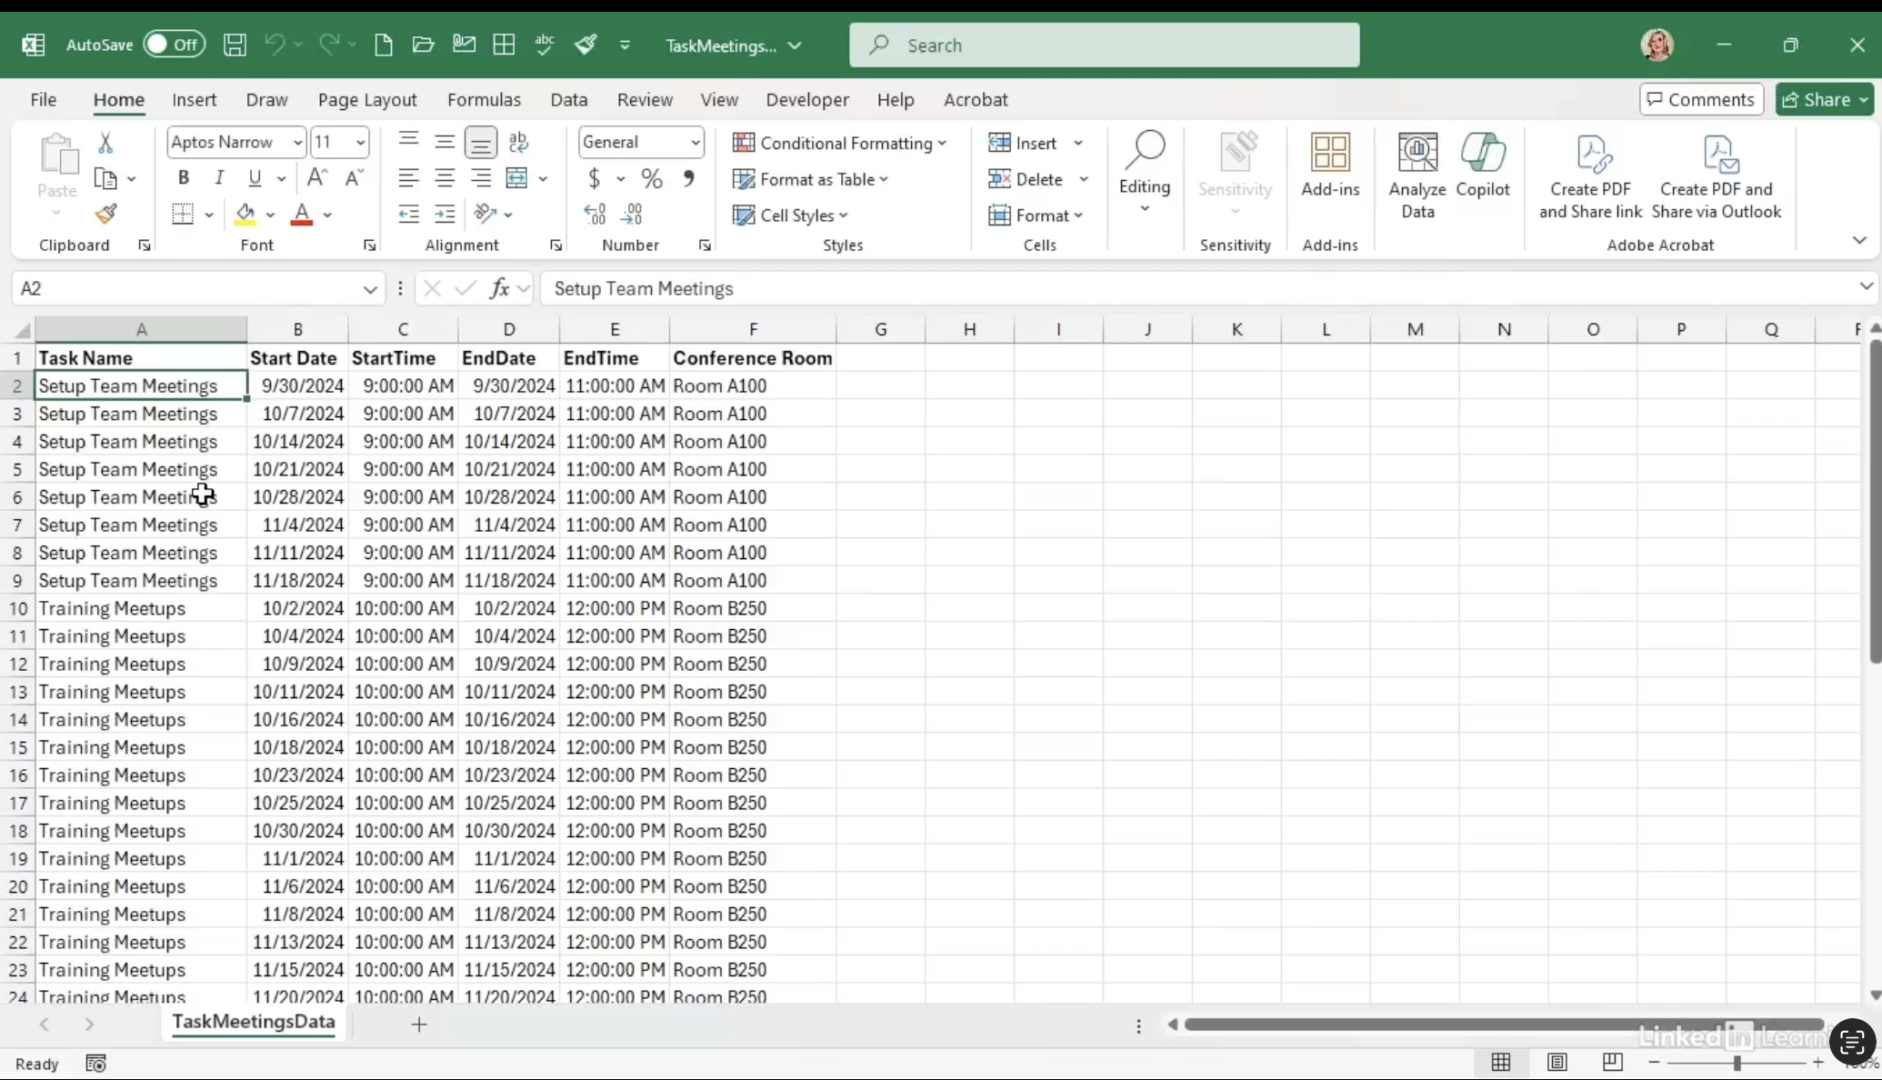
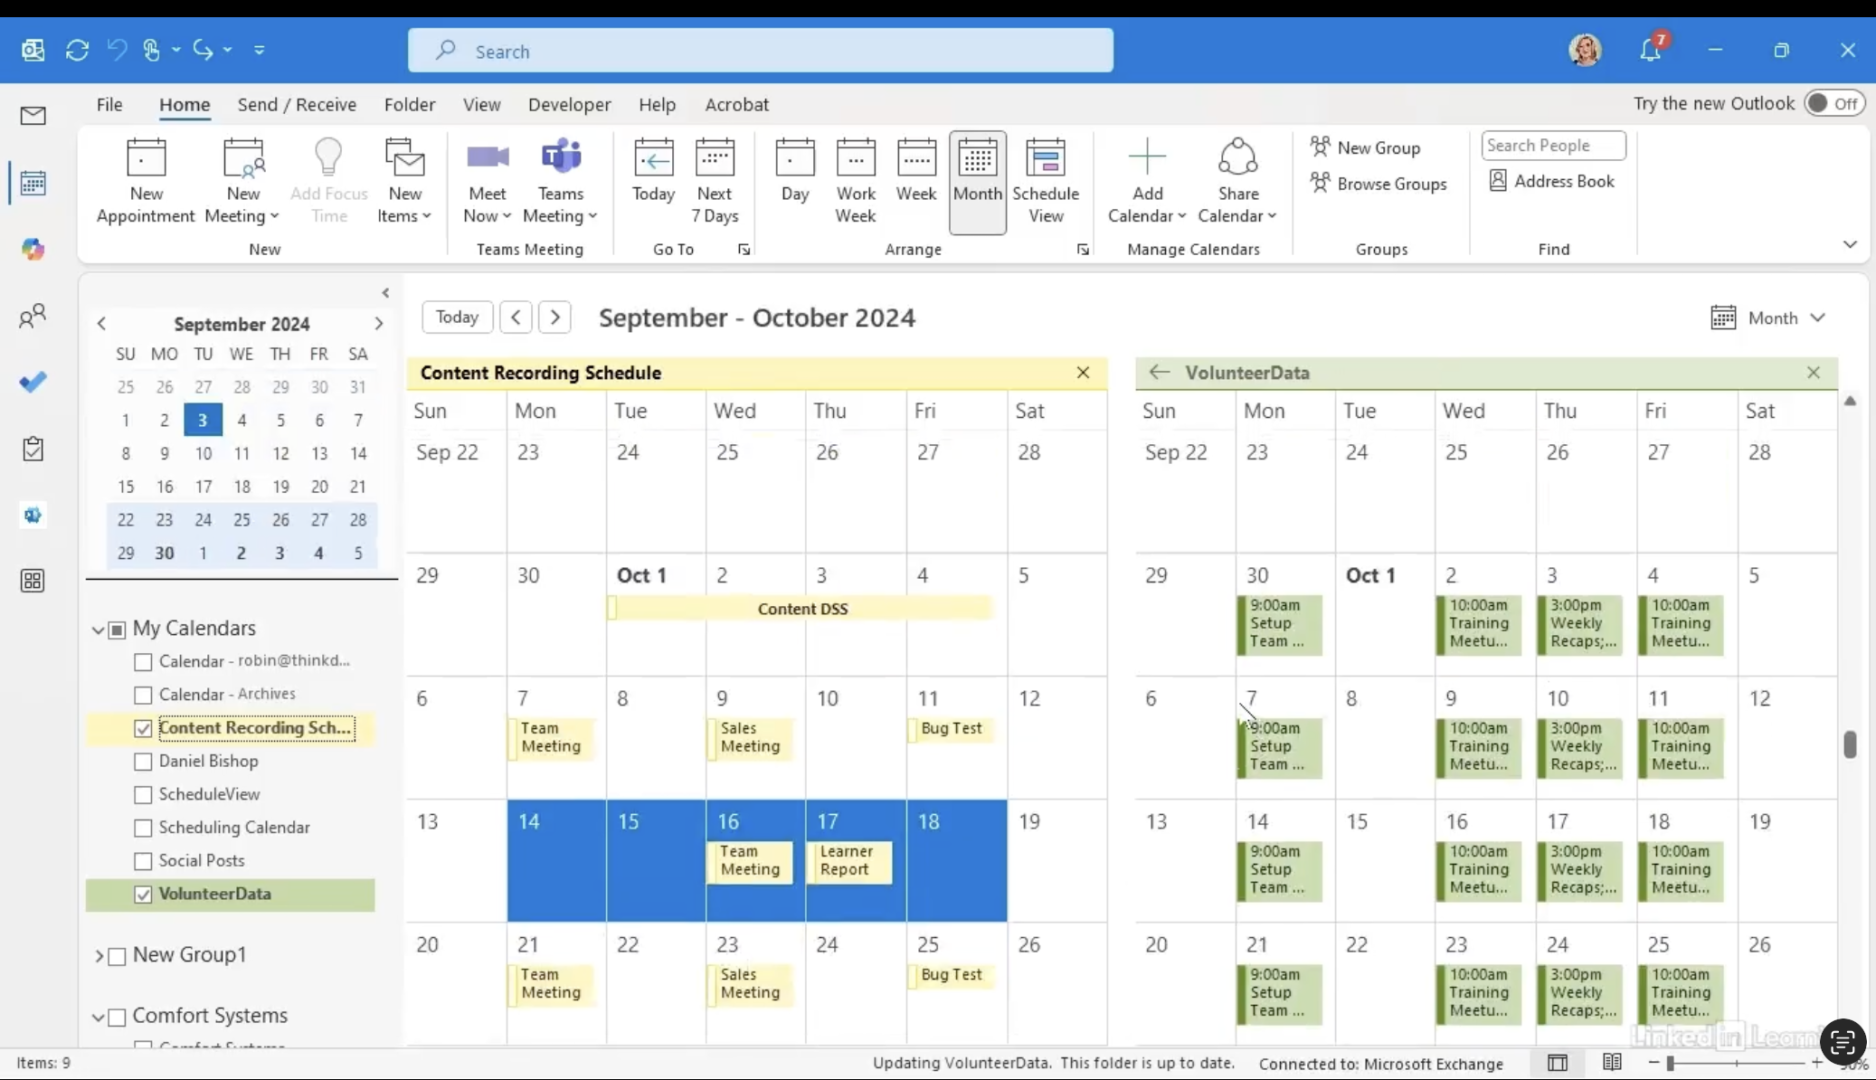
Learn how to transform datasets into Outlook calendar visuals. Date-related data is easier to understand when it’s shown on a calendar instead of a spreadsheet. In this Data Survival Skills session, Robin demonstrates how to import CSV data directly into Outlook to quickly build a calendar view. You’ll learn how to map fields like start date, end date, task name, and location so your events display correctly—without hand-keying appointments. With overlay mode, you can compare multiple calendars side by side, spot conflicts, and plan more effectively. This technique saves time, reduces errors, and turns raw date fields into a meaningful schedule you can actually work with.
#DataAnalytics #OutlookTips #DataVisualization #Productivity #WorkflowOptimization #DataSkills #Efficiency #CalendarManagement #BusinessIntelligence
If you’re a data analyst, you’ve no doubt learned different skills, techniques, and tools pertaining to data. But sometimes it can be difficult to know when and why to apply these tools. In this weekly series, instructor Robin Hunt explains a new skill, secret, tip, technique, best practice, or golden piece of advice in each installment. Robin covers topics that can help you do your job better, such as joining data and data designs, privacy for data, transforming and cleaning data, and making data sets and visualizing data.
Note: Because this is an ongoing series, viewers will not receive a certificate of completion.