Sub-Total: $0.00
Creating aggregated datasets
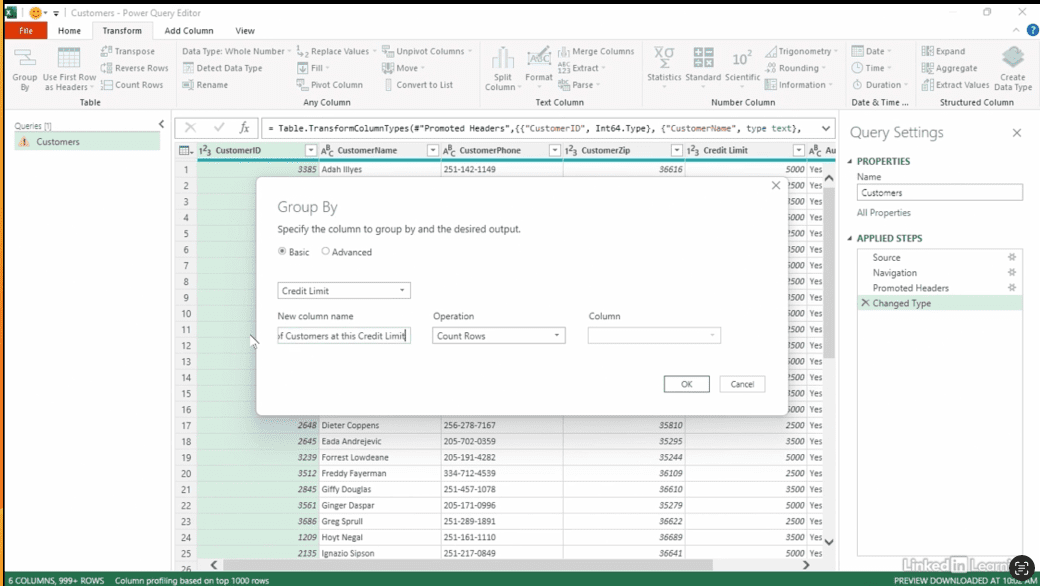
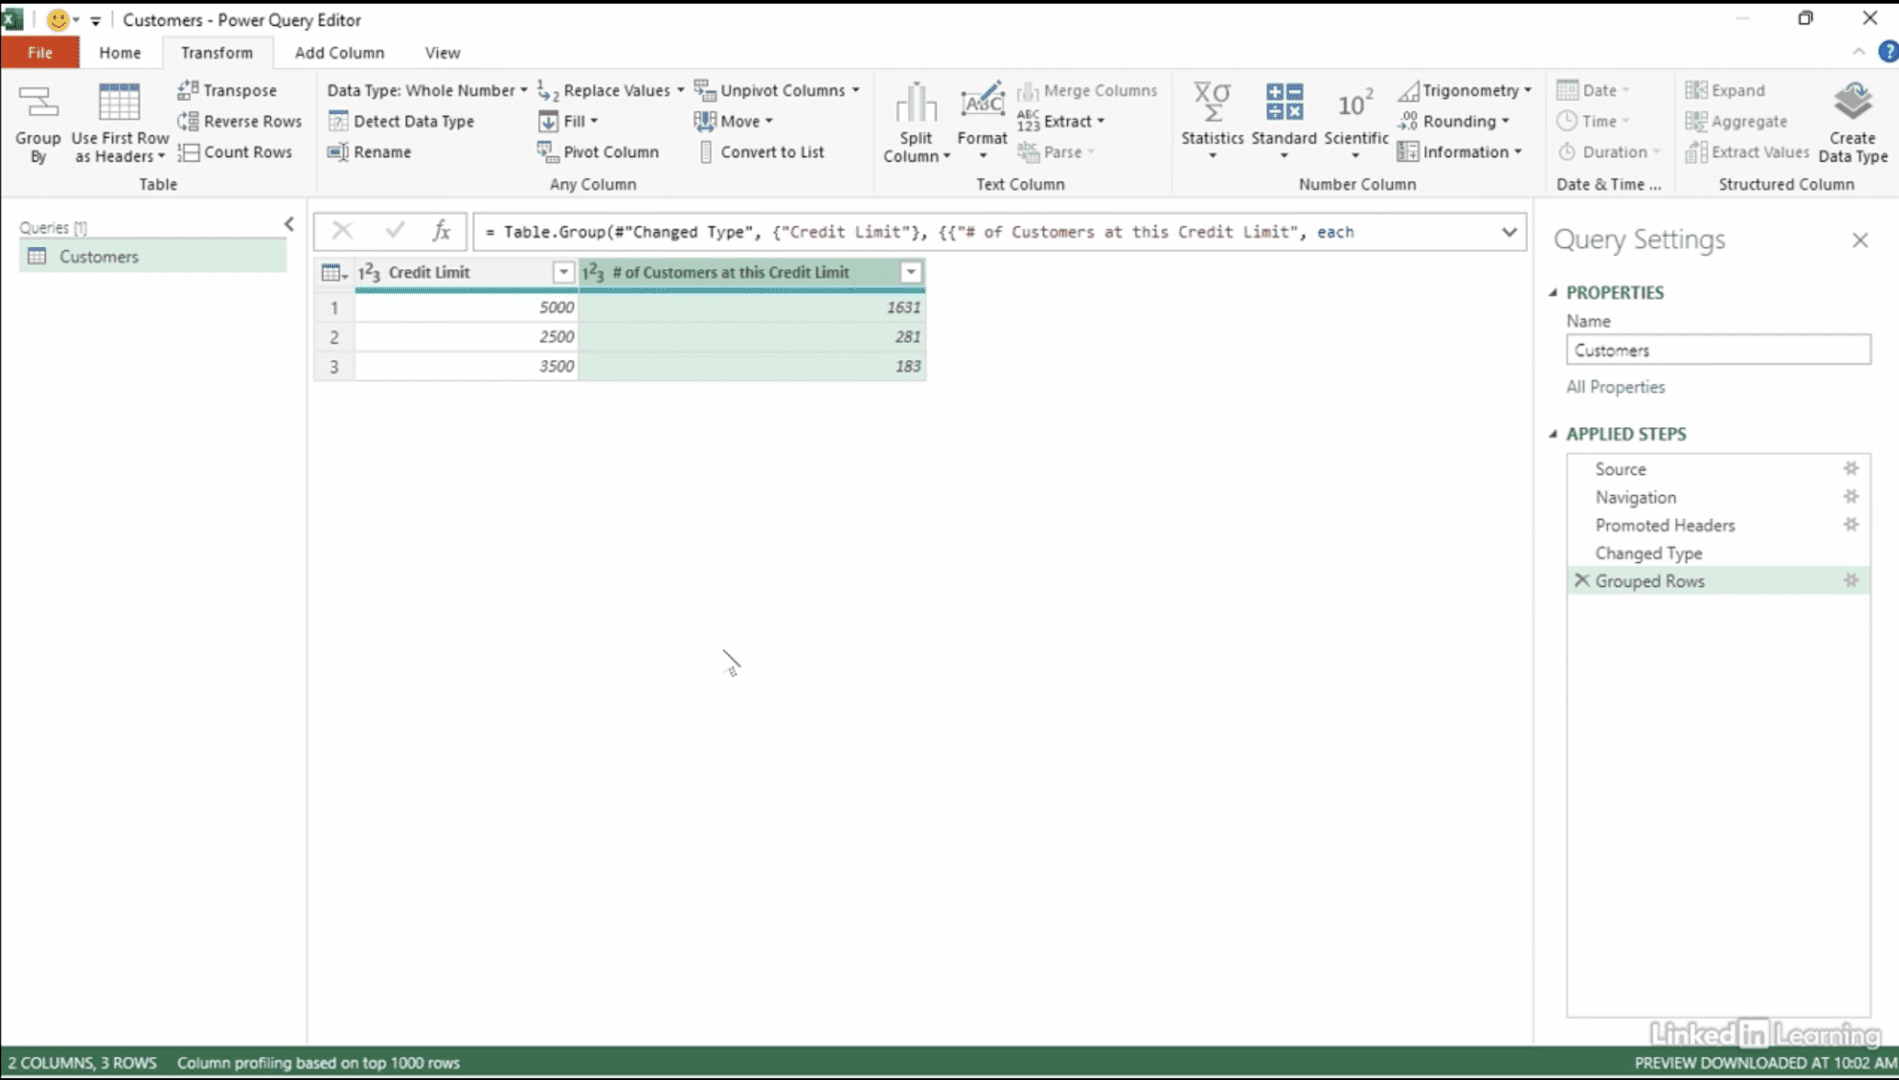
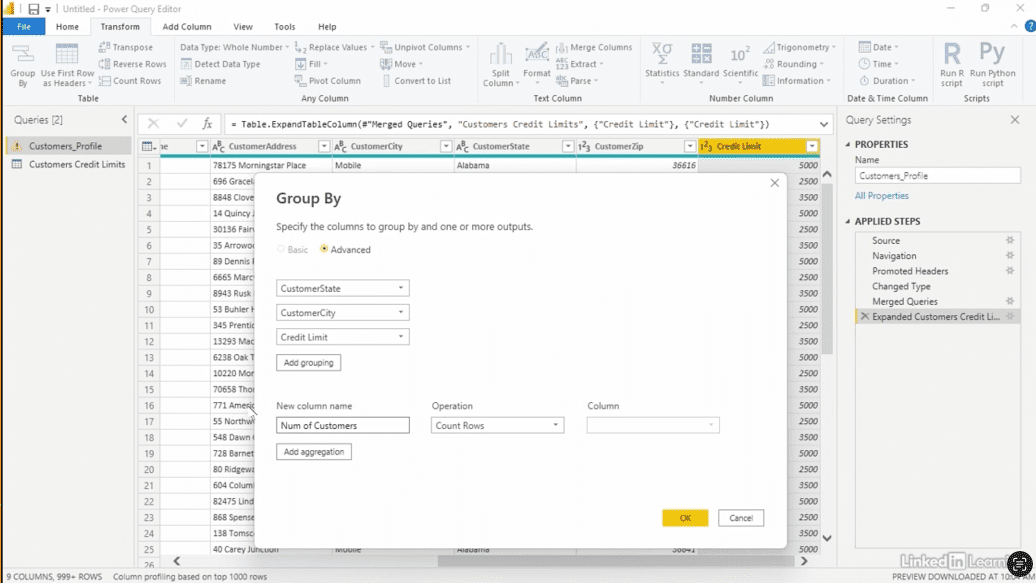
Learn how to turn detailed records into aggregated datasets that reveal insights without exposing sensitive information. In this Data Survival Skills session, Robin demonstrates how to group customer credit limits in Excel and then scale the analysis in Power BI. By merging client profiles with credit data, she shows how to build state- and city-level summaries, visualize customer credit patterns on maps, and display variations in credit values across regions. This approach highlights trends and supports executive decision-making while protecting individual records—delivering clarity, security, and impact in your reporting.
#DataAggregation #Excel #PowerBI #BusinessIntelligence #DataVisualization #DataAnalysis #DataPrivacy #DataModeling #Analytics
If you’re a data analyst, you’ve no doubt learned different skills, techniques, and tools pertaining to data. But sometimes it can be difficult to know when and why to apply these tools. In this weekly series, instructor Robin Hunt explains a new skill, secret, tip, technique, best practice, or golden piece of advice in each installment. Robin covers topics that can help you do your job better, such as joining data and data designs, privacy for data, transforming and cleaning data, and making data sets and visualizing data.
Note: Because this is an ongoing series, viewers will not receive a certificate of completion.