Sub-Total: $0.00
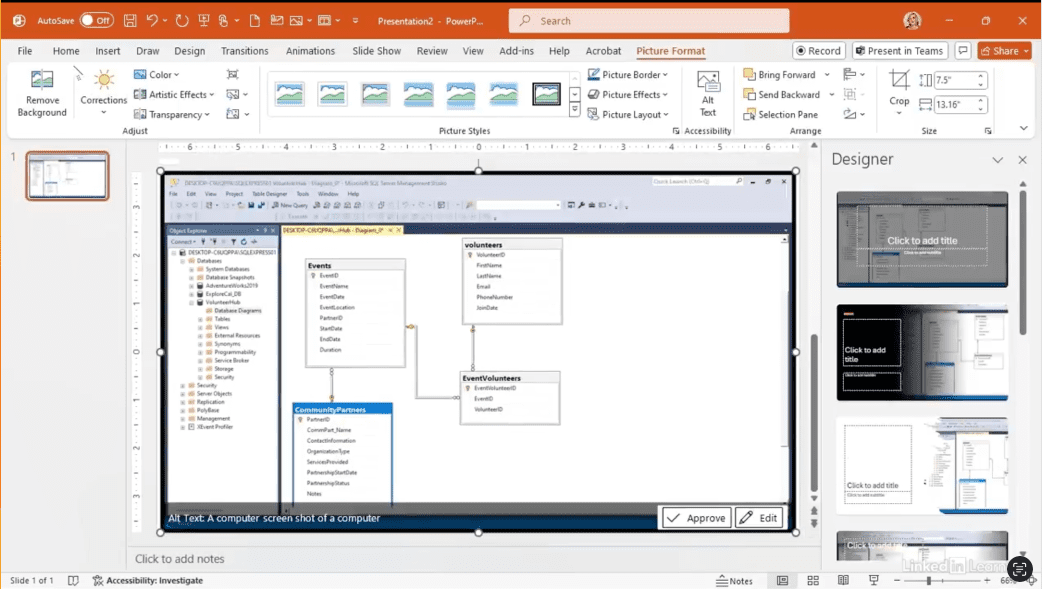
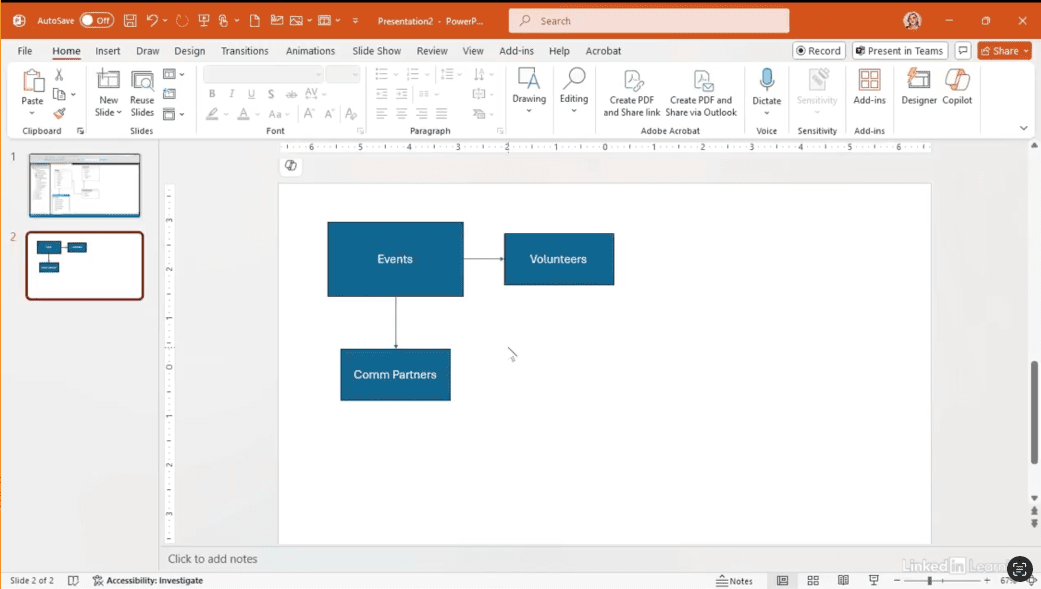
Diagramming Data and Processes
Learn how to design user interfaces for better data entry. In this Data Survival Skills session, Robin shows how to translate data requirements into simple, effective UI mockups. Starting with a volunteer signup form, you’ll see how to think through fields, dropdowns, and workflows—even using basic tools like PowerPoint. The goal isn’t to make something pretty, but to capture the logic of how people will enter and interact with data before building in Microsoft Forms, Power Apps, or other tools. By practicing low-fidelity design, you’ll avoid bad data, communicate ideas clearly to leadership, and ensure that your systems collect the right information from the start. Get started and using a variety of tools available to begin diagramming data and processes.
#DataSkills #UIDesign #PowerApps #Microsoft365 #DataQuality #WorkflowDesign #Productivity

If you’re a data analyst, you’ve no doubt learned different skills, techniques, and tools pertaining to data. But sometimes it can be difficult to know when and why to apply these tools. In this weekly series, instructor Robin Hunt explains a new skill, secret, tip, technique, best practice, or golden piece of advice in each installment. Robin covers topics that can help you do your job better, such as joining data and data designs, privacy for data, transforming and cleaning data, and making data sets and visualizing data.
Note: Because this is an ongoing series, viewers will not receive a certificate of completion.