Sub-Total: $0.00
Use Copilot to see insights in your data
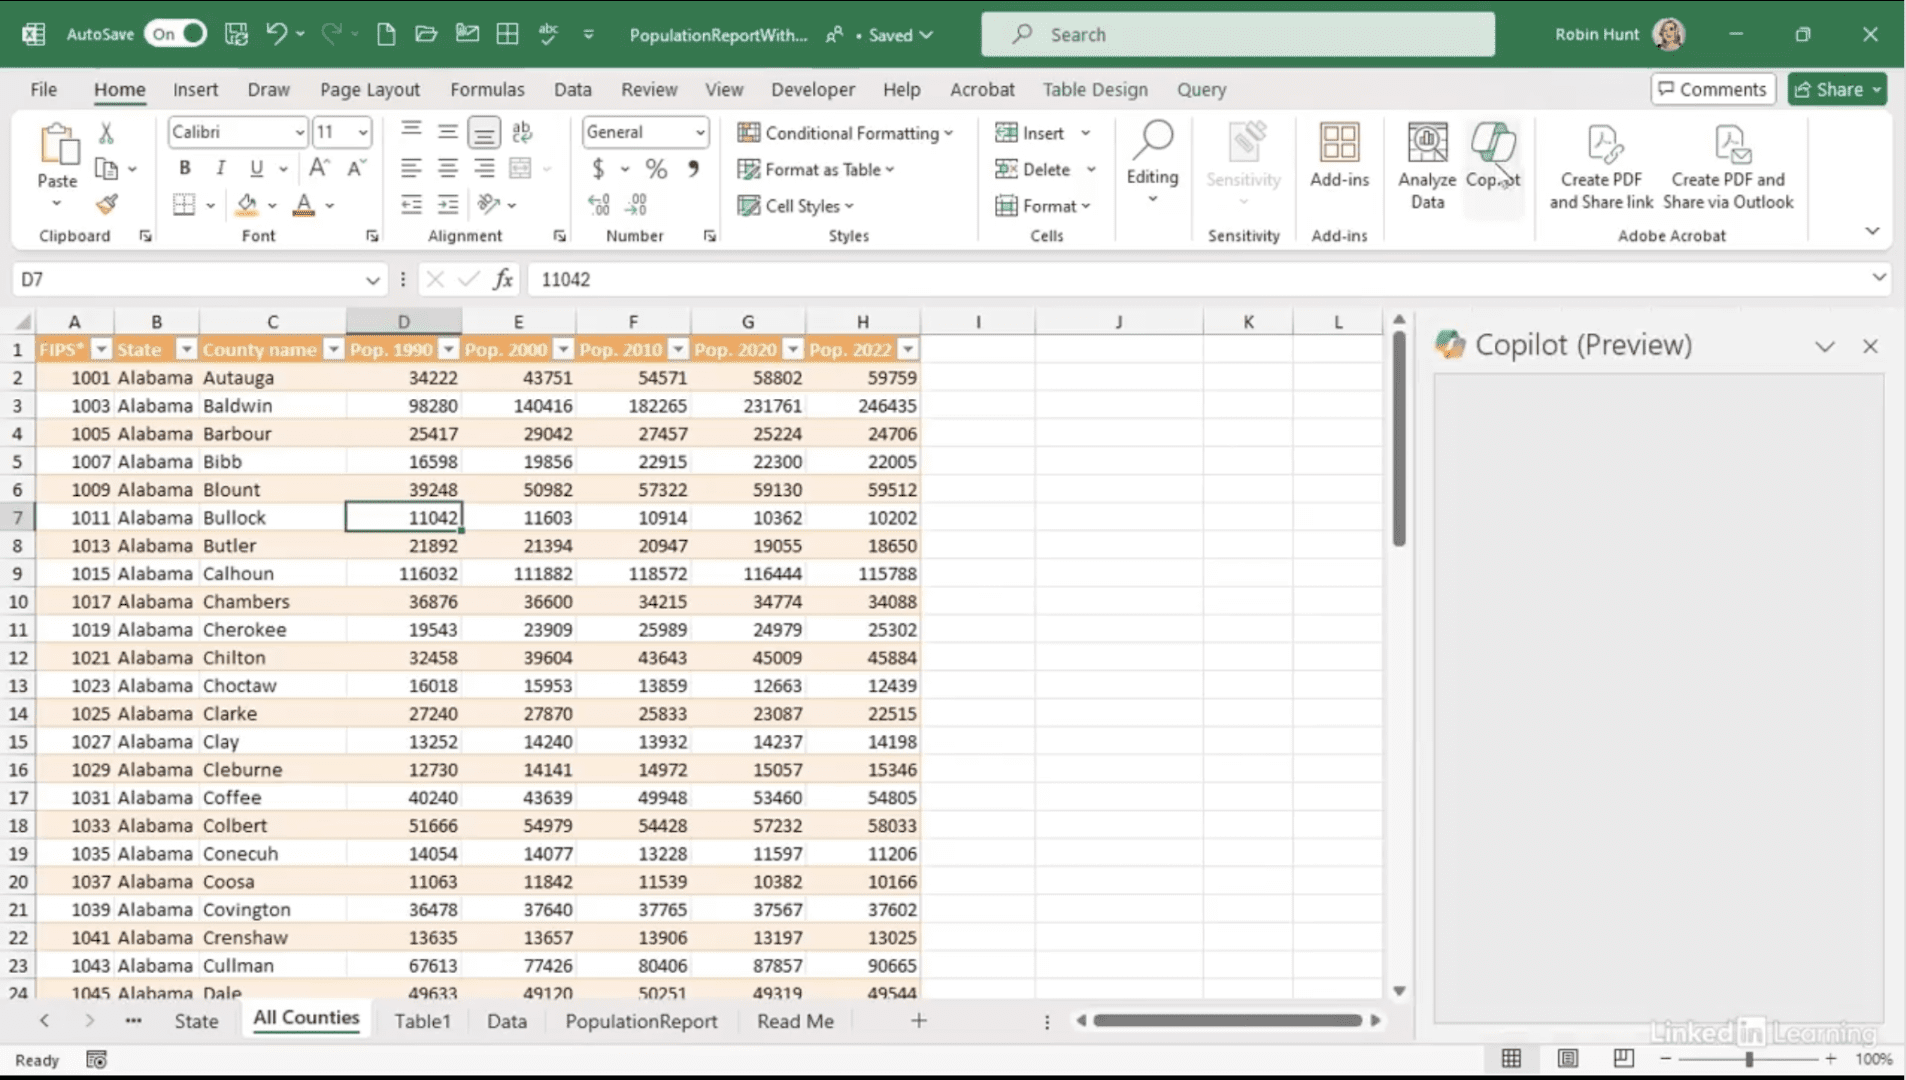
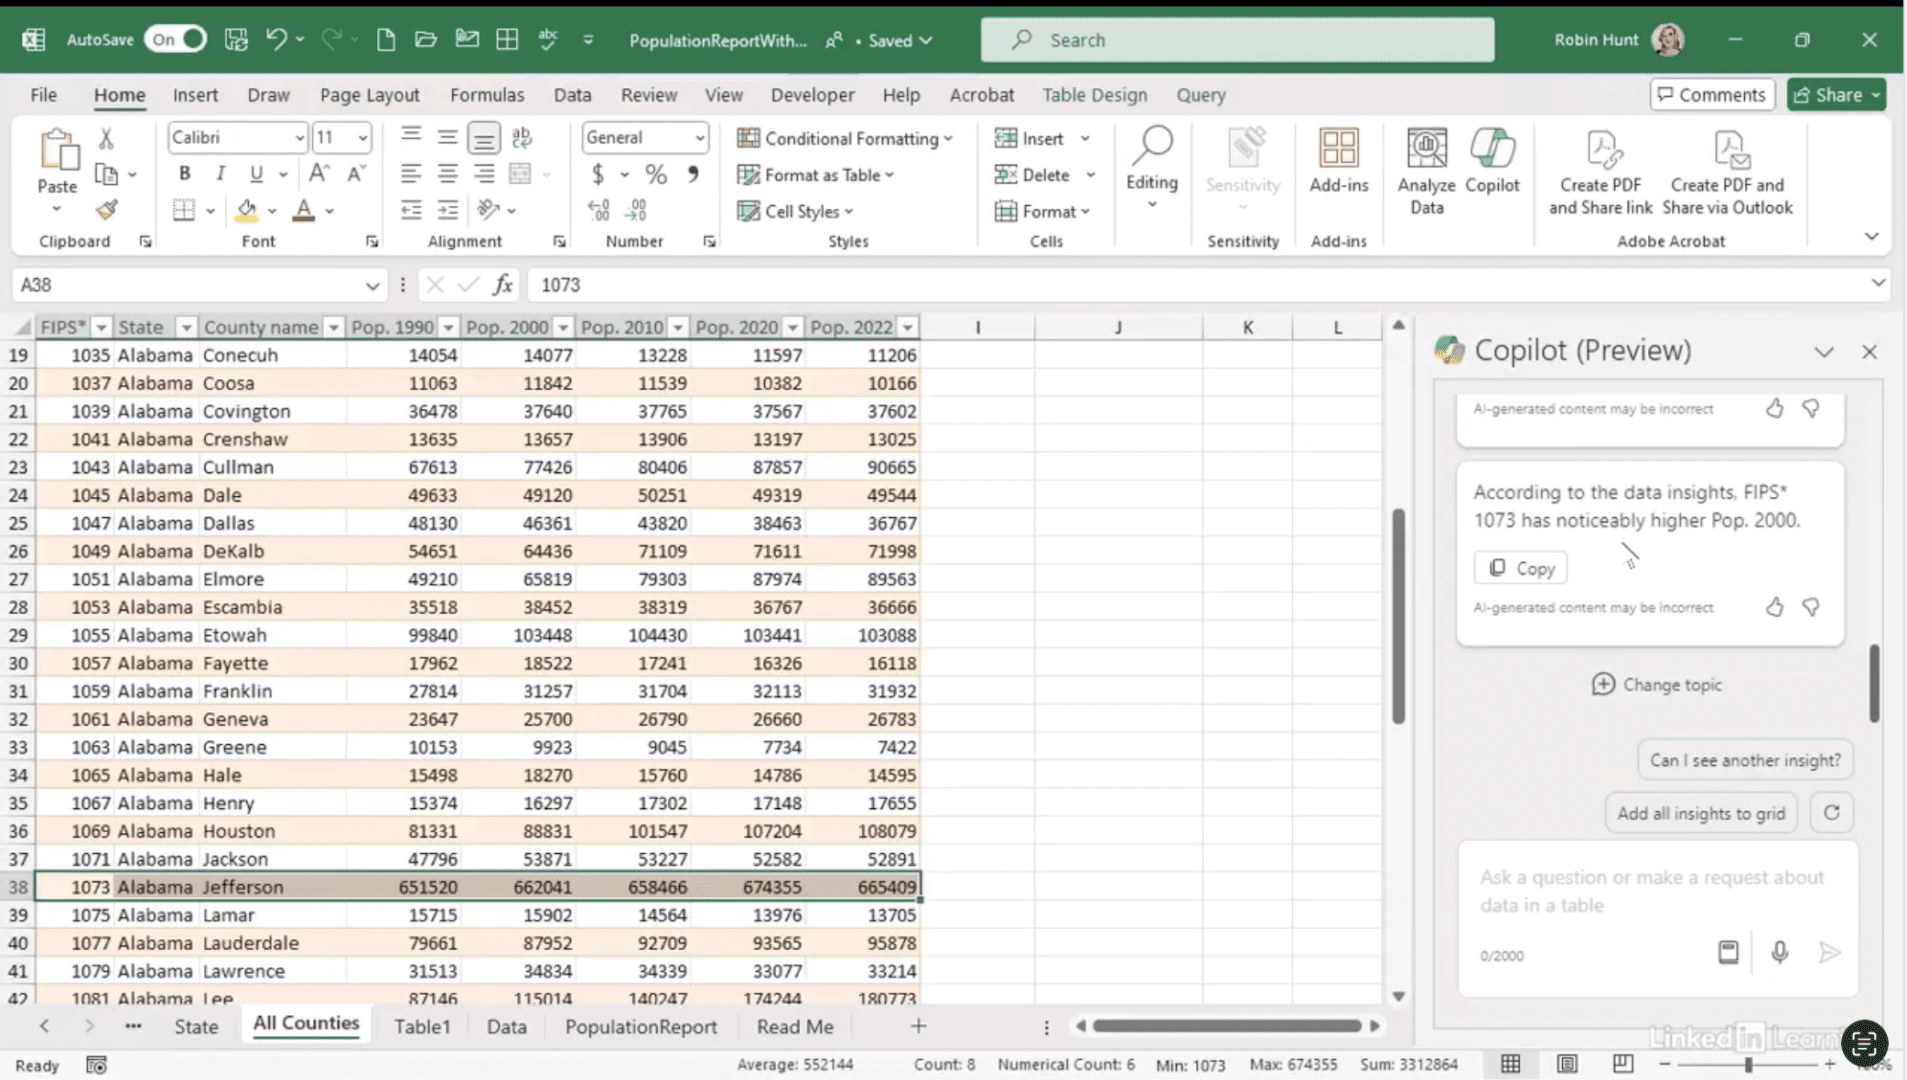
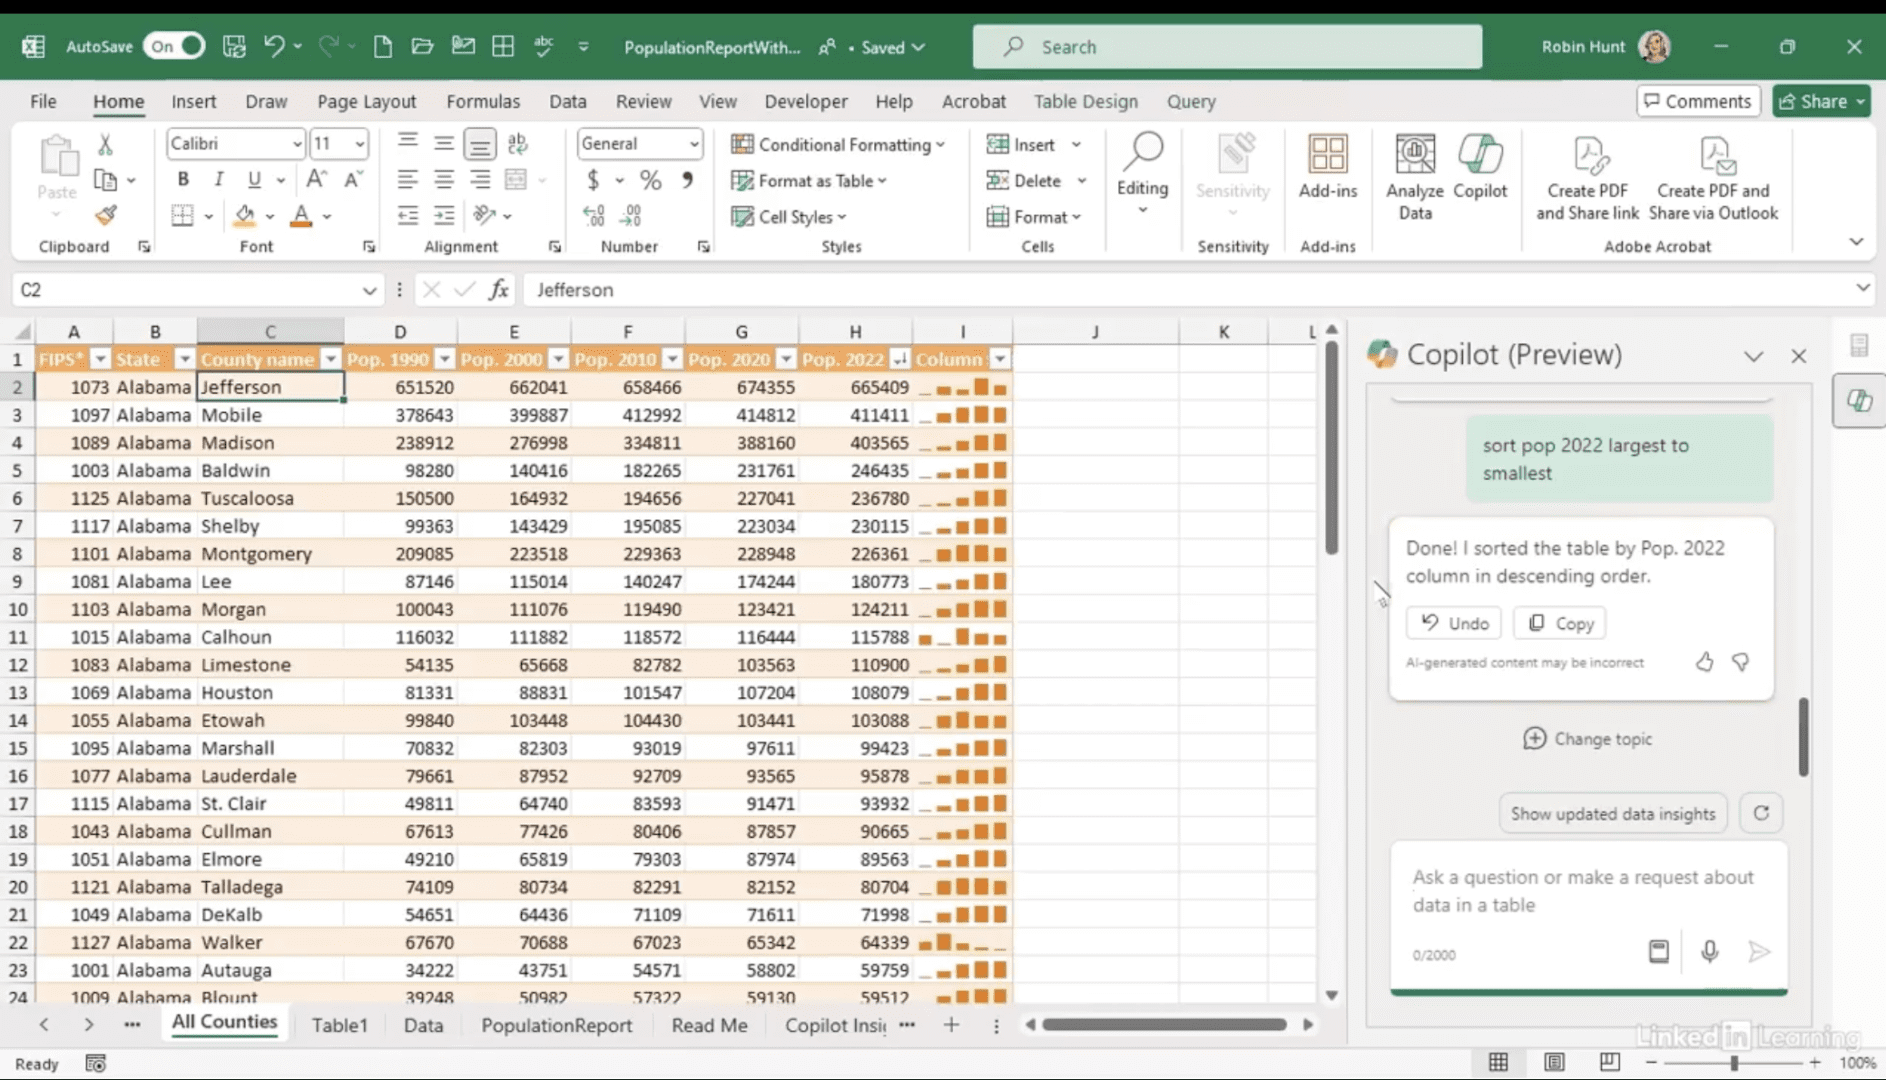
Discover how to use Copilot to quickly explore and understand your datasets. In this Data Survival Skills session, Robin shows how to use Power Query to remove distracting fields before diving into insights with Copilot. With a cleaner dataset, Copilot surfaces trends like population growth and highlights outliers such as Jefferson County. You’ll see how to validate Copilot’s suggestions, adjust calculations, and add sparklines to quickly spot changes over time. By combining Power Query’s structure with Copilot’s speed, you can uncover meaningful patterns and create visuals that truly tell your data’s story.
#DataAnalytics #Excel #Copilot #PowerQuery #DataVisualization #BusinessIntelligence #DataExploration #Productivity
If you’re a data analyst, you’ve no doubt learned different skills, techniques, and tools pertaining to data. But sometimes it can be difficult to know when and why to apply these tools. In this weekly series, instructor Robin Hunt explains a new skill, secret, tip, technique, best practice, or golden piece of advice in each installment. Robin covers topics that can help you do your job better, such as joining data and data designs, privacy for data, transforming and cleaning data, and making data sets and visualizing data.
Note: Because this is an ongoing series, viewers will not receive a certificate of completion.