Creating aggregated datasets
Creating aggregated datasets
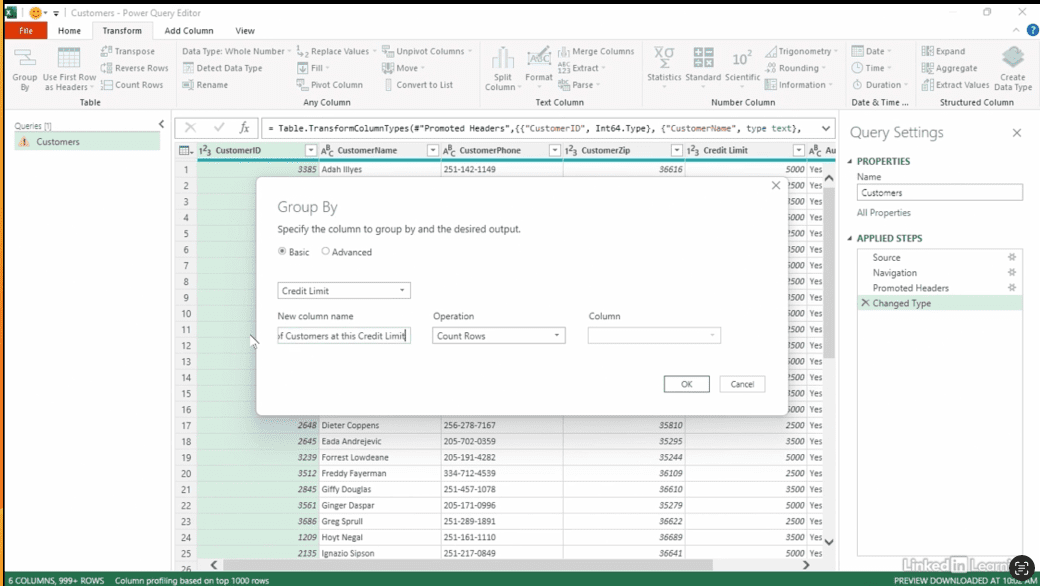
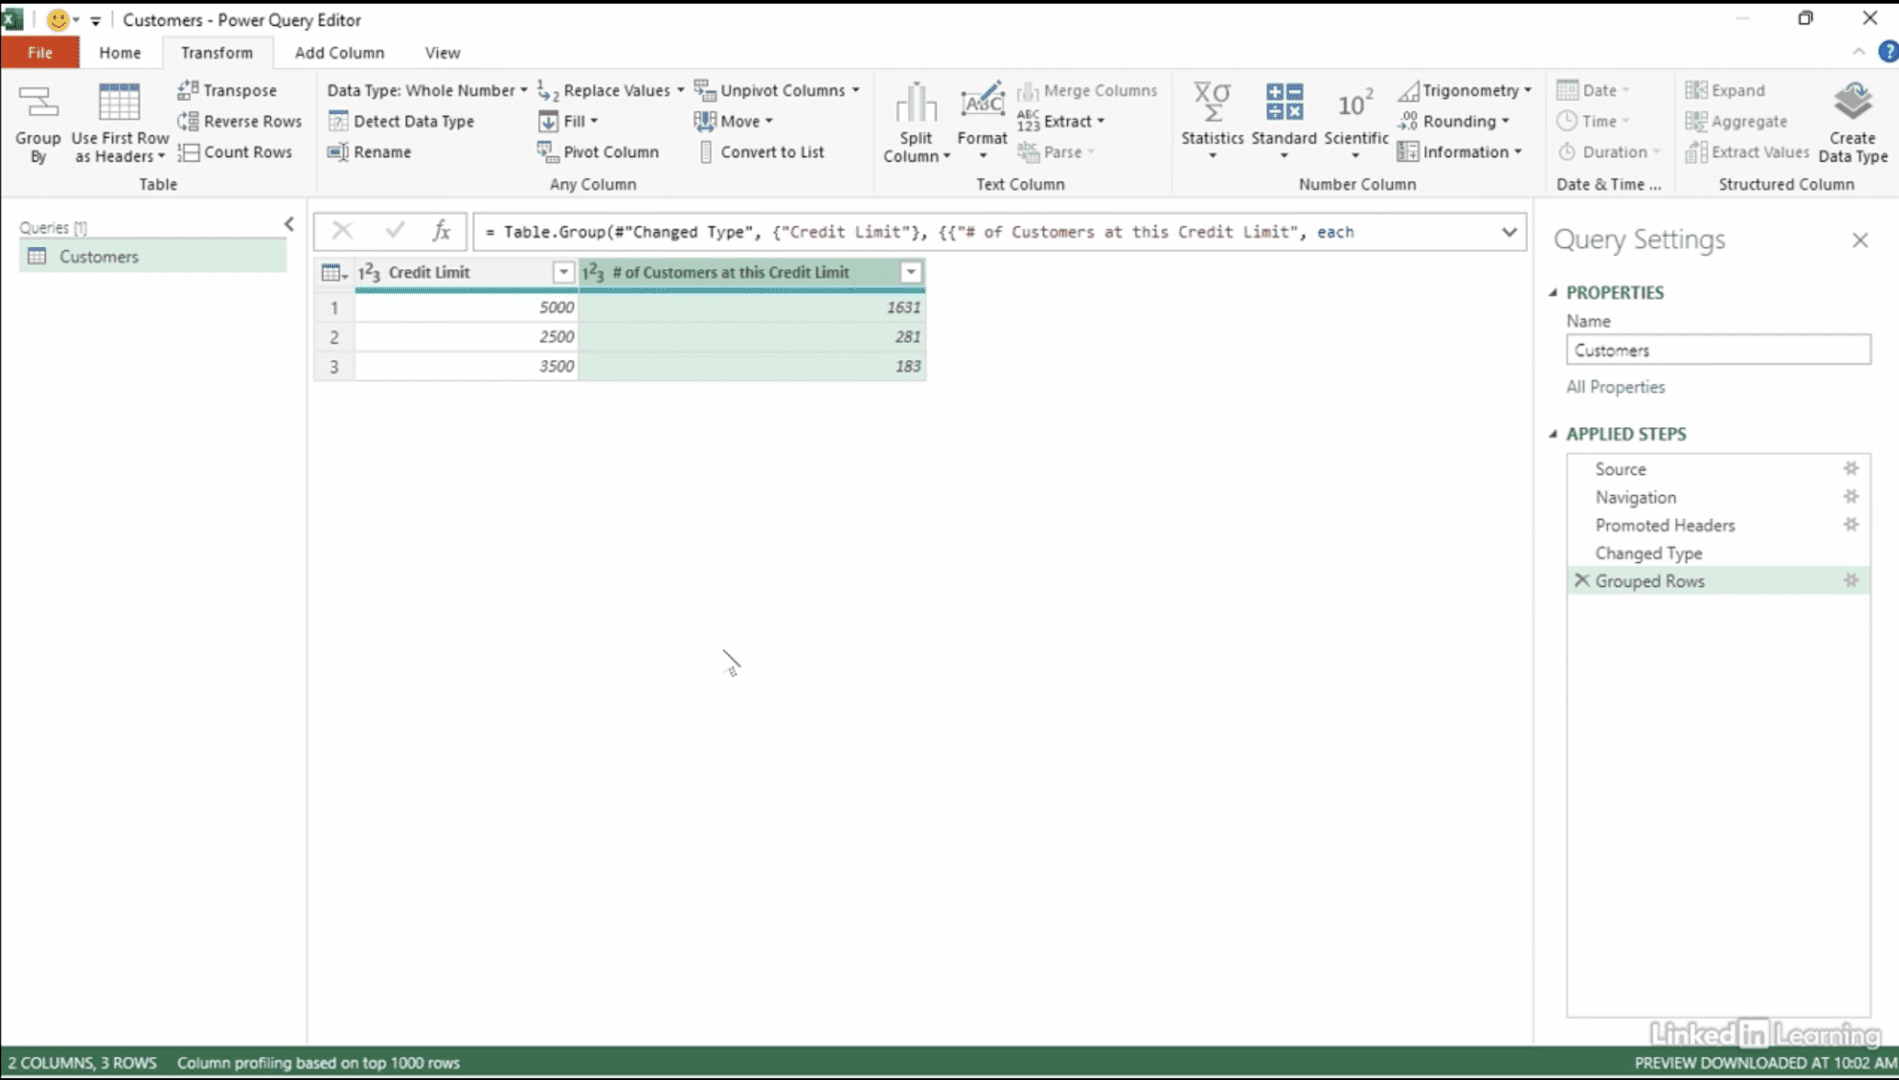
Creating aggregate data sets is vital for effective data analysis and decision-making. Aggregation involves summarizing large volumes of detailed data into a more manageable and meaningful form, which helps in identifying trends, patterns, and insights that are not immediately apparent in raw data.
One key importance of aggregate data sets is that they simplify complex data, making it easier to interpret and analyze. By condensing thousands or millions of data points into summary metrics like averages, totals, or counts, you can focus on the bigger picture rather than getting lost in the details. This simplification is crucial for reporting and dashboard creation, where clear, high-level insights are needed.
Aggregated data sets also enhance performance and efficiency. Analyzing raw data can be computationally intensive and time-consuming, especially with large data volumes. Aggregates reduce the data size, leading to faster query processing and more responsive reports. This efficiency is particularly important in business intelligence tools like Power BI, where real-time data analysis and quick decision-making are essential.
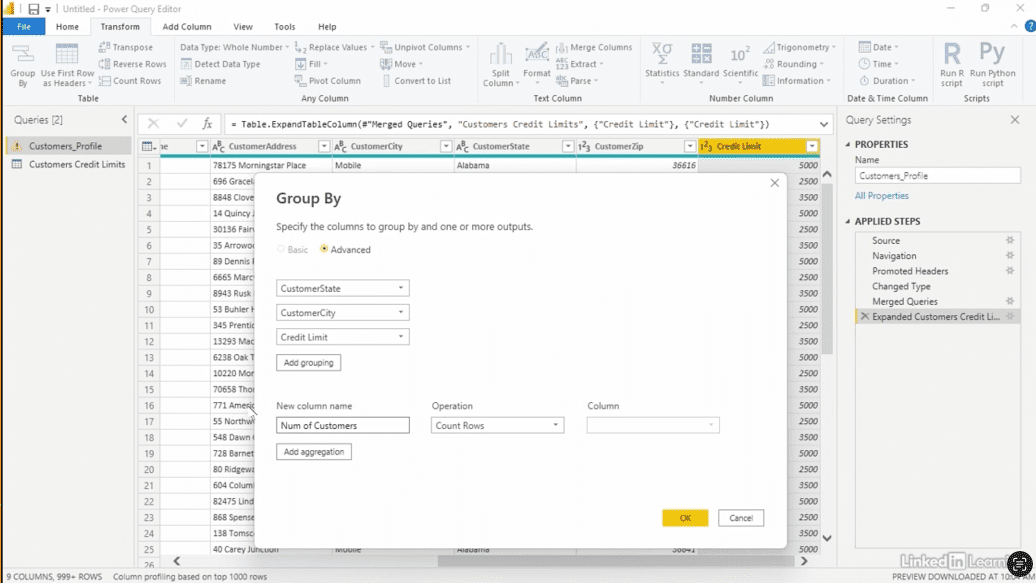
Moreover, aggregate data sets enable more accurate and strategic decision-making. By summarizing data across different dimensions—such as time periods, geographical regions, or customer segments—you can uncover trends and correlations that guide business strategies. For example, analyzing monthly sales data at a regional level can reveal seasonality patterns or growth opportunities that might be missed when looking at individual transactions.
In summary, the ability to create aggregate data sets is critical because it simplifies data analysis, improves performance, and supports more informed and strategic decision-making. Aggregation turns raw, detailed data into actionable insights that drive business success.
If you’re a data analyst, you’ve no doubt learned different skills, techniques, and tools pertaining to data. But sometimes it can be difficult to know when and why to apply these tools. In this weekly series, instructor Robin Hunt explains a new skill, secret, tip, technique, best practice, or golden piece of advice in each installment. Robin covers topics that can help you do your job better, such as joining data and data designs, privacy for data, transforming and cleaning data, and making data sets and visualizing data.
Note: Because this is an ongoing series, viewers will not receive a certificate of completion.


