Videos

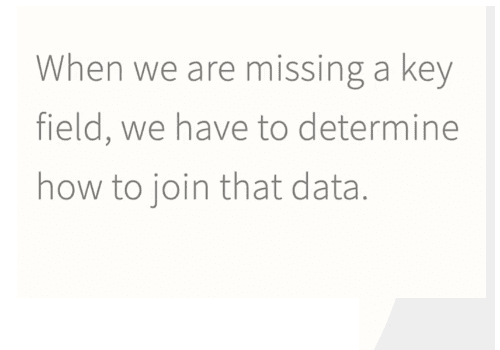
Creating unique identifiers between two data sets
Creating unique identifiers between two data sets When a join is required, and the field...

DFU: Data-Driven Decision Making
***For best viewing experience log in to LinkedIn*** November 22, 2022 - Today's episode is...

Networking in Tech
We’re continuing our series with a lesson on networking. Watch this Meetup Live recording with...

DFU: When Data Gets Scary
***For best viewing experience log in to LinkedIn*** October 25, 2022 - Oz du Soleil...

DFU: Plan Your Learning Path
***For best viewing experience log in to LinkedIn*** September 13, 2022 - On this episode...

DFU: Bias
July 13, 2022 - We are excited to have expert Stacey A. Gordon join us...

DFU: Common Sense
***For best viewing experience log in to LinkedIn*** April 13, 2022 - Common sense is...

DFU: Data Ethics
***For best viewing experience log in to LinkedIn*** March 10, 2022 - Doug Rose joins...

DFU: Math and Statistics
***For best viewing experience log in to LinkedIn*** February 24, 2022 - Today we figure...

DFU: Seasonality
***For best viewing experience log in to LinkedIn*** December 2, 2021 - Seasonality is the...
