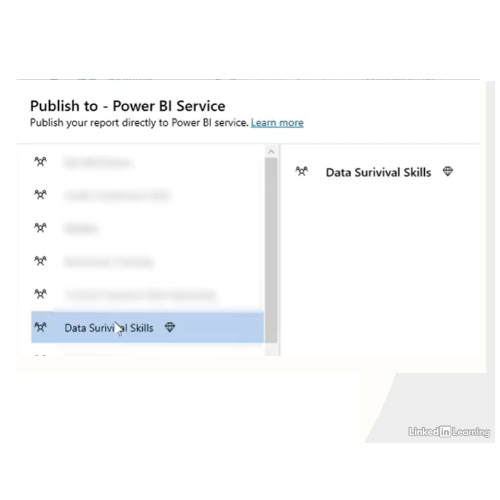
Using Different Pivot Formats to Share Stories

A woman working on a computer.

Learn how to enhance storytelling with pivot and matrix visualizations in Power BI. In this Data Survival Skills session, Robin demonstrates how dashboards provide only a surface view, while pivot structures enable deeper exploration of the data model. She walks through techniques for sorting, filtering, applying conditional formatting, and calculating percentages to surface meaningful insights…

Read More

Perform basic analysis on Datasets

A woman working on a computer.

Learn how to perform basic analysis on datasets. Every dataset has a story—and it often starts with the mean, median, and mode. In this Data Survival Skills session, Robin shows how to use Power Query and Excel to clean data, standardize fields, and calculate averages that reveal meaningful insights. You’ll learn how to transform messy…

Read More

Using analysis commands built into Popular Tools

A woman working on a computer.

Discover the power of built-in analysis tools. Most modern data tools—including Excel—come with analysis features that can uncover insights quickly, no coding required. In this Data Survival Skills session, Robin demonstrates how to clean and prepare data in Power Query, then use Excel’s Analyze Data feature to surface patterns, correlations, and trends instantly. She also…

Read More

Basic dates analysis

A woman working on a computer.

Learn how to reveal hidden gaps in your booking data. Traditional reports often miss the story behind no activity—days and weeks where bookings never happened. In this Data Survival Skills session, Robin shows how to use Excel and Power Query to merge booking records with a complete date table, making it easy to spot missing…

Read More

Building paginated reports in Power BI

A screenshot of the Power BI service page showcasing building paginated reports.

Learn how to build paginated reports that scale with your data. Dashboards are great for visual exploration, but when you need detailed, multi-page printouts, paginated reports are essential. In this Data Survival Skills session, Robin demonstrates how to leverage a single Power BI dataset to create reports that are both printable and interactive. You’ll learn…

Read More

Edit visual interactions

A woman working on a computer.

Learn how to make dashboards truly interactive and user-friendly. Dashboards are only valuable if users can explore data without confusion or error. In this Data Survival Skills session, Robin demonstrates how to set up visuals that interact as intended—connecting to shop data, applying page filters, creating slicers, and managing interactions between charts and cards. By…

Read More

Using Joins and Update Queries to Create Markers in the Data

A woman working on a computer.

Learn how to keep orders organized and accurate with joins and update queries. In this Data Survival Skills session, Robin works with Leaf & Mortar’s orders from both stores and pop-up shops. Starting with a master order table, she imports the pop-up shop data, links it using order numbers, and updates a new field to…

Read More

Building Date Tables in Power BI/Power Query 

A woman working on a computer.

Learn how to streamline time-based analysis by building a reusable date table in Power Query. In this Data Survival Skills session, Robin starts with a blank query and uses a custom function to generate a continuous range of dates. She then normalizes the table by adding key attributes such as month name, month number, weekday,…

Read More

Using Make Tables to normalize a denormalized data set

A woman working on a computer.

Discover how to turn messy spreadsheets into an organized, normalized database with Microsoft Access. In this Data Survival Skills session, Robin takes Leaf & Mortar’s order and customer list and shows how to make it easier to manage. She starts by importing a CSV file, then uses simple queries to pull out unique values and…

Read More

Using Append queries to combine spreadsheets

A woman working on a computer.

Learn how to combine multiple spreadsheets into a single dataset with append queries in Power Query. In this Data Survival Skills session, Robin demonstrates how to bring in individual Excel files—such as order data from four different shop zones—and merge them into one clean, analysis-ready table. She shows how to connect each file directly from…

Read More