Archive for October 2023
Analyzing data using a matrix and conditional formats
Analyzing data using a matrix and conditional formats Have an Excel sheet with pivot tables full of data? Want to visualize those in Power BI in meaningful ways? Let Robin step you through the next part of her work making graphs out of (and gaining additional insights from) this booking data. Learn How To: Use…
Read MoreUsing Different Pivot Formats to Share Stories
Using different pivot formats share stories Every visual tells a story. Learn how to use Pivots to share different stories on the same data. Learn How To Use Different Pivot Formats The Data Skills Survival Kit Series If you’re a data analyst, you’ve no doubt learned different skills, techniques, and tools pertaining to data. But…
Read MorePerform basic analysis on Datasets
Perform basic analysis on data sets No single data set is exactly the same. Learn how to do the basic analysis techniques to learn more about your data. Learn How To Analyze Data Sets The Data Skills Survival Kit Series If you’re a data analyst, you’ve no doubt learned different skills, techniques, and tools pertaining…
Read MoreUsing analysis commands built into Popular Tools
Using the analysis commands built into popular tools Most systems have some basic analysis built in to the software. Learn how to take your analysis up a step using these built-in tools. Learn How To Use Analysis Commands The Data Skills Survival Kit Series If you’re a data analyst, you’ve no doubt learned different skills,…
Read MoreData Fundamentals Unpacked: Scary Data Words
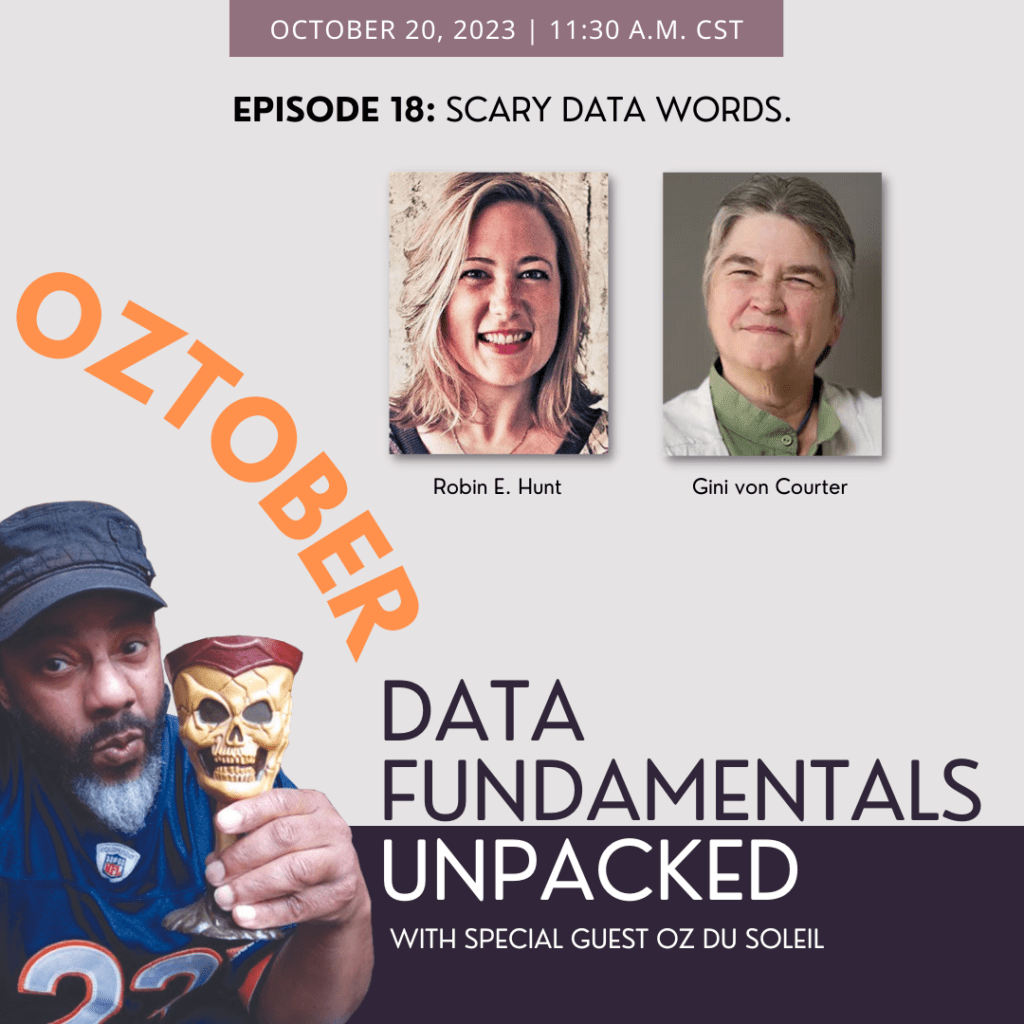
October 20, 2023 – Robin, Gini, and Oz talked through some SCARY data words again this year- watch out for kurtosis! If you too have felt intimidated or overwhelmed by an unfamiliar data word, give this episode a watch and let the team reassure you that you’re not alone. On Data Fundamentals Unpacked, we’re always…
Read MoreBasic dates analysis
Using basic dates analysis It’s in the gap you can tell the story. This is a must watch video. This will show you how to gain some great data structure for data that needs to exist. Also, if you don’t know this trick there are reports you are unable to write and dashboards you will…
Read MoreBuilding The Data Workforce – Helen Wall
Helen Wall is a data analytics and business analysis expert. Helen is skilled in data analysis—querying, analyzing, and modeling data to gain insights—and creating visualizations that illustrate metrics, to help businesses make informed decisions. In her role as a senior financial analyst, she currently improves reports, streamlines processes, and monitors projections, contributing to the forecasting…
Read MoreBuilding The Data Workforce – Bill Shander
Bill Shander is an information designer, helping clients turn their data into compelling visual and often interactive experiences. He teaches data storytelling, information design and data visualization on LinkedIn Learning, at the University of Vermont, and in workshops around the world. Clients include the World Bank, Starbucks, multiple U.S. Government agencies, Big Four firms, and…
Read MoreBuilding The Data Workforce – Oz du Soleil
Oz du Soleil, Microsoft Excel MVP, Author, YouTube Creator By day, Oz uses Excel to battle Crap Data, blazing trails through data’s dusty badlands. By night, he’s a collector of kaleidoscopes. With a fiery passion for teaching and a vicious spirit in the wild west of data, Oz has taught classes for entities like Xfinity,…
Read MoreBuilding The Data Workforce – Gini von Courter
Gini von Courter has taught computer classes on Microsoft Office for 20+ years and has authored 30+ books. Gini has been providing computer classes and seminars on Microsoft Office and related products for more than 20 years at public and private companies, state and federal agencies, educational institutions, and not-for-profit organizations, and has consulted and…
Read More


