Training on demand

Training on Demand

Want to read what we think is interesting? Do you want to easily access videos and events that you can rewatch?  This is the place for you. We also know that everyone has different learning styles, ideas, and plans that work best for them. There are a mix of free and paid options although we try to keep them to their own sections so that you can easily distinguish. We encourage you to explore the various topics and suggestions we’ve provided here and find what works for you.

A woman working on a computer.

Planning a Basic System for Data Collection

Plan a Basic System for Data Collection  Databases that capture data in real time with live data is a different design than data designs that are to just collect and report on data. Understanding data ...
A woman working on a computer.

Scripting views for SQL databases

Scripting views for SQL databases Learn how to take your SQL queries and script them into Views. These objects can then be used by other software like PowerBI, and Excel to build valuable reports and ...
A woman working on a computer.

Use Copilot to Create a Draft Presentation about your Data Project

Use Copilot to Create a Draft Presentation about your Data Project It will not be the final draft but learn how to leverage the power of Copilot with your data to create a great first ...
A woman working on a computer.

Using Remove Duplicates to Find the Latest or Earliest Record in Excel

Using Remove Duplicates to Find the Latest or Earliest Record in Excel You will learn how to leverage multi sort options to retrieve the appropriate record for your data analysis and/or reporting. Learn How To ...
A woman working on a computer.

Auditing Data and Spreadsheets

Auditing Data and Spreadsheets One keyway to ensure privacy and protection is to audit the files. Look at the file a way another might. Let's uncover ways to audit a file quickly by using the ...
A woman working on a computer.

Visualizing data sets in Outlook

Visualizing data sets in Outlook People are constantly trying to build calendars. Knowing that Outlook reads data in the form of calendars has allowed me for decades to look over time in a calendar view ...
A woman working on a computer.

Building Data Sets inside of Outlook

Building data sets inside of Outlook Having my data skills means that I look at every program I use as a data machine. That means I am going to put data in it; and take ...
A woman working on a computer.

Mapping Data into Other Software Tools

Mapping Data into Other Software Tools Data everywhere - and plenty of places to put it. A key to data survival and well data quality is being able to leverage data for other places without ...
A woman working on a computer.

Designing relationships for databases

Designing relationships for databases Learn how to design relationships for a basic database. If you can understand how to create relational designs, then you will understand how to read great designs and deal with bad ...
A woman working on a computer.

Creating a SharePoint back end from a database

Creating a SharePoint back end from a database Learn how to get the most of a relational design and a live database backend at the same time. Not everything you will do will get a ...
A woman working on a computer.

Creating tables and joins to recode data

Creating tables and joins to recode data There are times where you can't write a enough replace commands, or conditional statements to clean bad data. Learn how to create a control table to clean data ...
A woman working on a computer.

Merging data and building basic calculations into a data set

Merging data and building basic calculations into a data set Learn how to merge data from different sources and build basic calculations into a dataset. See how to analyze data by creating a comprehensive dataset ...
A woman working on a computer.

Adding data leveraging cross joins

Adding data leveraging cross joins We use joins in data to effectively report on data, but have you ever considered using them to create data? When faced with adding repetitive data for a project that ...
A woman working on a computer.

Using date functions to create follow up data

Using date functions to create follow up data When you have data; you can use it to create valuable data sets to help automate or notify for other processes. Learn how to use date functions ...
A woman working on a computer.

Build letter size for reports using Power BI Desktop

Build letter size for reports using Power BI Desktop You need all the features of PowerBI desktop, but at the end of the refresh process this information needs to be packaged and sent via PDF. ...
A woman working on a computer.

Build paginated reports

Build paginated reports Learn how to quickly build basic paginated reports using PowerBI Report Builder. Learn How To Build Paginated Reports The Data Skills Survival Kit Series If you're a data analyst, you've no doubt ...
A woman working on a computer.

Building a brief for a data project

Building a brief for a data project We spend so much time on techniques to visualize data but little on how to get the information into the hands of others. It's not always about the ...
A woman working on a computer.

Establishing a cohort data set

Establishing a cohort data set There are times when you want to study the behaviors of a data set, and how one group might compare to others. Learning how to establish a basic cohort will ...
A woman working on a computer.

Adding additional data to your cohorts

Adding additional data to your cohorts Once cohorts data sets are established you will find yourself leveraging them for various studies. You will find it can be helpful to add additional data points to your ...
A woman working on a computer.

Leveraging the Advanced Editor in Power Query to share cleaning routines

Leveraging the Advanced Editor in Power Query to share cleaning routines When you work in a team but on solo projects you can find yourself with some advanced cleaning routines. These routines could likely be ...
A woman working on a computer.

Creating simple data sets with basic visuals for presentations

Creating simple data sets with basic visuals for presentations Learn how to create simple datasets and transform them into visually appealing charts and graphs using Microsoft Excel. Discover techniques for formatting and customizing these visuals ...
A woman working on a computer.

Analyzing top and bottom scenarios

Analyzing top and bottom scenarios Analyze the top and bottom scenarios within a dataset using Power BI. Covers how to present data context, filter top and bottom records, and create visualizations to compare different data ...
A woman working on a computer.

Designing a basic system for data capture

Designing a basic system for data capture Learning how to design basic systems even if it is just building a basic tables is a survival skill for sure. It helps you survive by letting you ...
A woman working on a computer.

Use Copilot in Excel to teach you about the data

Use Copilot in Excel to teach you about the data The goal of this video is to show how to ask basic prompts to quickly learn about the data which will help you further validate ...
A woman working on a computer.

Use Copilot to build basic functions in Excel

Use Copilot to build basic functions in Excel Use Copilot in Excel to assist in building basic functions and calculations. Watch how Copilot can guide you through solving calculation issues, even if it doesn't get ...
A woman working on a computer.

Use Copilot to do basic cleanup commands

Use Copilot to do basic cleanup commands Use Copilot in Excel for basic data cleanup tasks, such as removing unnecessary columns and formatting data. Learn How To Use Copilot Cleanup Commands The Data Skills Survival ...
A woman working on a computer.

Use Copilot to see insights in your data

Use Copilot to see insights in your data How to leverage Copilot in Excel to explore data insights, including removing unnecessary columns and visualizing population changes over time.   Learn How To Use Copilot for ...
A woman working on a computer.

Use Copilot in Word to build documentation about your data project

Use Copilot in Word to build documentation about your data project Use Copilot in Microsoft Word to assist with documentation and research for data projects. Experience how Copilot can generate tables and lists from text ...
A woman working on a computer.

Diagramming Data and Processes

Diagramming Data and Processes Visualizing data inside your head into diagrams can be a key skill. However, to be able to visualize data - you might have to build this skill. Learn keyways to get ...
A woman working on a computer.

Basic visualization of cohort data

Basic visualization of cohort data Visualize cohort data using Power BI to show progression over time. Cover structuring data for visualization and using matrix visuals to illustrate cohort progression. Learn How To Visualize Cohort Data ...
A woman working on a computer.

Using Remove Duplicates to Create Data Sets

Using Remove Duplicates to Create Data Sets You have a ton of data- it's just not modeled and workable. You can't quit. You must learn how to make data from the data you have. Learn ...
A woman working on a computer.

Adding data leveraging cross joins

Adding data leveraging cross joins A cross join in SQL is useful for creating all possible combinations of rows from two or more tables. It pairs each row from one table with every row from ...
A woman working on a computer.

Using Case statements for conditional logic in SQL queries

Using Case statements for conditional logic in SQL queries Creating CASE statements in SQL queries is important because it allows you to add conditional logic directly into your data retrieval process. Here's why it's valuable:Data ...
A woman working on a computer.

Analyzing data using a matrix and conditional formats

Analyzing data using a matrix and conditional formats Have an Excel sheet with pivot tables full of data? Want to visualize those in Power BI in meaningful ways? Let Robin step you through the next ...
A woman working on a computer.

Using Different Pivot Formats to Share Stories

Using different pivot formats share stories Every visual tells a story. Learn how to use Pivots to share different stories on the same data. Learn How To Use Different Pivot Formats The Data Skills Survival ...
A white background with black text, perfect for displaying data sets.

Perform basic analysis on Datasets

Perform basic analysis on data sets No single data set is exactly the same. Learn how to do the basic analysis techniques to learn more about your data. Learn How To Analyze Data Sets The ...
A woman working on a computer.

Using analysis commands built into Popular Tools

Using the analysis commands built into popular tools Most systems have some basic analysis built in to the software. Learn how to take your analysis up a step using these built-in tools. Learn How To ...
A woman working on a computer.

Basic dates analysis

Using basic dates analysis It's in the gap you can tell the story. This is a must watch video. This will show you how to gain some great data structure for data that needs to ...
A screenshot of the Power BI service page showcasing building paginated reports.

Building paginated reports in Power BI

Building paginated reports in Power BI Learn how to quickly build basic paginated reports using PowerBI Report Builder. Learn How To Make Paginated Reports In Power BI The Data Skills Survival Kit Series If you're ...
A woman working on a computer.

Building letter size reports for meetings using Power BI Desktop

Building letter size reports for meetings using Power BI Desktop Creating Power BI files that are printable or can be exported as PDF pages adds significant value for meetings and presentations. Here's why:Accessibility: Not everyone ...
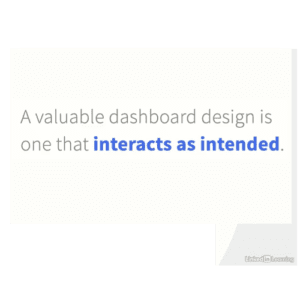
The value dashboard design is one that showcases exceptional visual interactions.

Edit visual interactions

Edit visual interactions  Learn how to create interactive dashboards with a few static items that never update. Learn How To Edit Interactions In Dashboards The Data Skills Survival Kit Series If you're a data analyst, ...
A woman working on a computer.

Using Joins and Update Queries to Create Markers in the Data

Using Joins and Update Queries to Create Valuable Markers in the data Joins can provide you a valuable way to link information, but they can also be used to create valuable markers or fields in ...
A woman working on a computer.

Building Date Tables in Power BI/Power Query 

Building Date Tables in Power BI/Power Query  Creating date tables is important in data analysis because they provide a structured way to analyze data over time. A date table includes every date within a certain ...
A woman working on a computer.

Using Make Tables to normalize a denormalized data set

Using Make Tables to normalize a denormalized data set We can't always control how we receive data. However, once we have that data we can make decisions that will help us better report on the ...
A woman working on a computer.

Using Append queries to combine spreadsheets

Using Append queries to combine spreadsheets You may discover that all your data is siloed into many different spreadsheets even though they contain the same structure. Learn how to create simple appends to create the ...
A woman working on a computer.

Using union queries to bring together data sets in SQL

Using union queries to bring together data sets in SQL Unions can be a valuable concept to understand when your data sets are in different tables or by different unique queries. Learn how to make ...
A woman working on a computer.

Build conditional functions to make data

Build conditional functions to make data The ability to create conditional formulas in Power BI is essential because it transforms raw data into meaningful, reliable information tailored for specific reporting needs. This capability is key ...
A woman working on a computer.

Cleaning data from a folder of files in Power BI

Cleaning data from a folder of files in Power BI Each week represents a new set of information for your reports. Learn how to create a report or spreadsheet by pulling data from a folder ...
A woman working on a computer.

Duplicate vs Reference in Power Query

Duplicate vs Reference in Power Query To duplicate or to reference, that is the question. The answer truly depends on the outcome you are trying to achieve. Learn the differences of both commands and how ...
A woman working on a computer.

Cleaning data from a PDF in Power BI

Cleaning data from a PDF in PowerBI Let's face it- sometimes the only information you have is in a beautiful formatted PDF file. Not to worry, you can clean it like it's a spreadsheet. Learn ...
A woman working on a computer.

Using Unpivot to build data sets from Survey Results

Using Unpivot to build data sets from Survey Results  Surveys are used to capture a ton of data. These tools typically provide some initial information but to really analyze and visualize some data you must ...
A woman working on a computer.

Creating aggregated datasets

Creating aggregated datasets  Creating aggregate data sets is vital for effective data analysis and decision-making. Aggregation involves summarizing large volumes of detailed data into a more manageable and meaningful form, which helps in identifying trends, ...
A woman working on a computer.

Using Functions to Mask Data

Using Functions to Mask Data Exploring Different methods to mask data for privacy (because data privacy is crucial data governance skills for all). Learn How To Use Functions To Mask Data The Data Skills Survival ...
A woman working on a computer.

Model or Merge- and what’s the difference? 

Model or Merge- and what's the difference?  You may wonder, "When is it best to model or to merge?" In this video we show the difference so you can decide based on your project needs. ...
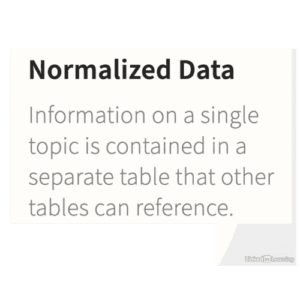
Data on a single topic is normalized in a separate table, which other tables reference.

Normalizing data to achieve a data design

Normalizing data to achieve a data design Normalizing data is typically the skill of a database designer, but when you are an analyst, you design data sets. No keys on how to break data to ...
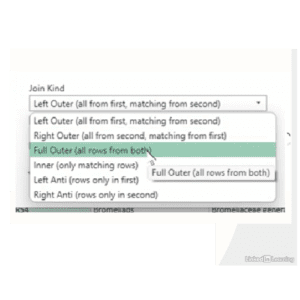
A screen shot of a window showing the settings for Microsoft Outlook and working with full outer joins.

Working with full outer joins

Working with full outer joins Often times we find as data workers we are trying to determine what is on two data sets. We want to see everything that matches or doesn't match from two ...
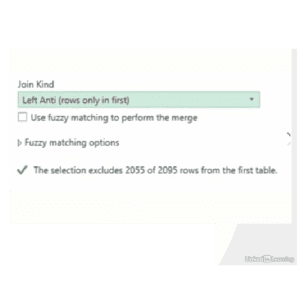
A screen displaying the settings for a Microsoft Excel spreadsheet, utilizing anti joins to search for data.

Using anti joins to search for data

Using anti joins to search for data We know that data sets cannot be achieved efficiently without adjusting joins so we learn about left and right joins. Then as we produce these results sometimes we ...
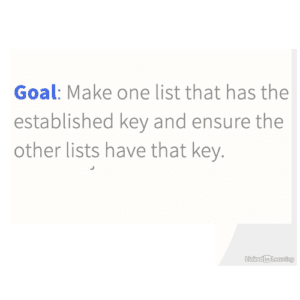
The goal is to join data with common data between two unrelated data sets, ensuring one list has an established key and incorporating that key into the other lists.

Joining data with common data between two unrelated data sets

Joining data with common data between two unrelated data sets Joining data is part of the life of a data analyst. The problem is that most data sets that need to be joined exist in ...
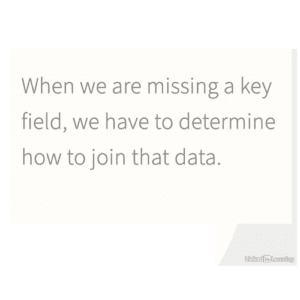
When we are missing a key field, we have to determine how to join the data by creating unique identifiers between two data sets.

Creating unique identifiers between two data sets 

Creating unique identifiers between two data sets When a join is required, and the field doesn't exist, you must learn to create a field to create a unique identifier. This will allow you to enjoy ...

Build Data Skills

We love it when our content is provided by our partners at no cost to the learner. This means you can can get started with very little risk, and begin to determine where you should spend your time and efforts.

Career Essentials Certificates 

Certification Prep

If you are currently pursuing data certifications you might want to consider certification prep materials.  These materials all have various costs associated to them. 

Modify the Compitia datasys+ logo for Data Systems+ brand.

CompTIA DataSys+ (DS0-001) Exam Prep Bundle

What you’ll learn The Official CompTIA DataSys+ material has been developed by CompTIA for the CompTIA certification candidate. Rigorously evaluated by third party subject matter experts to validate adequate coverage of the DataSys+ exam objectives, ...
Modify the Compitia datasys+ logo for Data Systems+ brand.

The Official CompTIA DataSys+ Student Guide (Exam DS0-001) eBook

What you’ll learn The Official CompTIA DataSys+ Study Guide (DS0-001) has been developed by CompTIA for the CompTIA certification candidate. Rigorously evaluated by third party subject matter experts to validate adequate coverage of the DataSys+ exam objectives, ...
CompTIA Data+ certification logo.

The Official CompTIA Data+ Student Guide (Exam DA0-001) eBook

What you’ll learn The Official CompTIA Data+ Instructor and Student Guides (DA0-001) have been developed by CompTIA for the CompTIA Data+ candidate. Rigorously evaluated to validate coverage of the CompTIA Data+ (DA0-001) exam objectives, the ...

CompTIA Data+ Training

You could say we wrote the book on Data+ and that's true,we actually did write the book. We are proud of the content created for the Official Curriculum for the first certification of its kind. We have tons of options for you to explore. Read Announcement | Read About Exam