Sub-Total: $0.00
Video Posts
Videos
We make lots of educational video content, come take a look!
+
Courses Offered
+
Training in person
1. million+
Asynchronous Learning
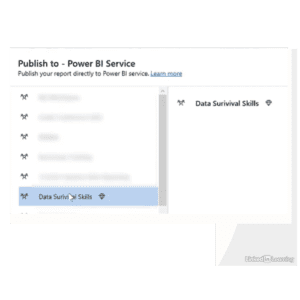
Data Survival Skills on LinkedIn Learning
The data survival skills is a biweekly series that is full of data survival skills for different scenerios and different tools.
Automating Workflows from a SharePoint list with Power Automate

This video explains how to automate notifications from a SharePoint list using Power Automate to improve awareness and responsiveness when new data is added. Robin demonstrates creating a flow from a prebuilt template that sends ...
Visualizing SharePoint List Data in Excel for Dynamic Reporting
This video demonstrates how to quickly visualize SharePoint list data using Power BI to validate whether early-stage data looks accurate and reasonable. Robin walks through integrating a SharePoint list directly into Power BI from the ...
Conversational Data Exploration in Power BI with Fabric and Copilot
This video explores how Copilot in Power BI with Fabric can support fast, conversational data exploration to help teams gain insights and communicate value early. Robin demonstrates exporting SharePoint data into a Fabric workspace and ...
Turn Spreadsheets into Future Dashboard Designs
Turn Spreadsheets into Future Dashboard Designs In this video, you'll learn how to transform an existing Excel spreadsheet into the foundation of a dynamic, refreshable dashboard. Using a live SharePoint list as the data source, ...
How to Create a Dataset in a Sharepoint List
How to Create a Dataset in a Sharepoint List Learn how to create structured datasets in SharePoint for better reporting. In this Data Survival Skills session, Robin shows how to build a Near Miss reporting ...
Designing User Interfaces for Data Entry into Your Solution
Learn how to design user interfaces for better data entry. In this Data Survival Skills session, Robin shows how to translate data requirements into simple, effective UI mockups. Starting with a volunteer signup form, you'll ...
Using Pivot Column to Look at Text Data in a Pivot
Discover how to turn messy text data into clear, powerful visuals in seconds. Pivot tables are powerful for counts and summaries-but they fall short when you need a true schedule. In this Data Survival Skills ...
Testing Data Entry in Data Designs
Learn how to test your data before design problems get too big. In this Data Survival Skills session, Robin demonstrates how to use Power Query to connect and test datasets before moving forward with design. ...
Designing basic forms for data entry into your solution
Learn how to design smarter forms that keep your data clean and usable. In this Data Survival Skills session, Robin demonstrates how to build forms in Microsoft Access that guide data entry and protect against ...
Testing data in your new database design
Learn how to strengthen your database design with testing and referential integrity. In this Data Survival Skills session, Robin shows why every database-no matter how small the budget-needs testing at each stage. Using a volunteer ...
Defining nomenclature for fields to reduce data issues
Learn how to define a clear nomenclature to make your data instantly more readable and actionable. Data can be confusing when key identifiers aren't meaningful-but a structured naming system changes that. In this Data Survival ...
Visualizing subgroups when searching for insights
Learn how to uncover deeper insights by analyzing subgroups in your data. Demographics aren't the only way to slice a dataset-sometimes the most meaningful patterns appear in behavioral subgroups. In this Data Survival Skills session, ...
Cleaning Survey Data for the Purposes of Analysis
Learn how to fix messy text data with a simple control table in Power Query. In this Data Survival Skills session, Robin demonstrates how to take inconsistent survey responses-like multiple spellings of the same tour ...
Working with Different Group Sizes
Learn how to compare uneven group sizes with PivotTables and charts in Excel. Not all data sets are balanced-sometimes one subgroup is much larger than another. In this Data Survival Skills session, Robin shows how ...
Understanding and Communicating Impacts
Learn how to uncover the real impact behind a single number with Excel's loan amortization tools. A monthly payment might look affordable at first glance-but what about the total cost over time? In this Data ...
Creating subgroups for use in visuals and basic analysis
Learn how to clean and restructure survey data to uncover insights about tool usage across different groups. In this Data Survival Skills session, Robin demonstrates how to transform messy survey exports by selecting the right ...
Planning a Basic System for Data Collection
Learn how to turn multiple data sources into a unified collection that drives real insights. In this Data Survival Skills session, Robin explores the fundamentals of data collections-how to identify which datasets matter, where they ...
Scripting views for SQL databases
Tired of re-running queries and exporting CSVs? 🚀 In this Data Survival Skills session, Robin shows how to use SQL views to turn one-time queries into reusable datasets. With SQL Server Management Studio, she walks ...
Use Copilot to Create a Draft Presentation about your Data Project
Learn how to build smarter presentations with Microsoft Copilot in PowerPoint. Every data story needs a strong first draft. In this Data Survival Skills session, you'll see how to turn Word documents and Excel spreadsheets ...
Using Remove Duplicates to Find the Latest or Earliest Record in Excel
Learn how to find the latest or earliest customer orders using Remove Duplicates in Excel. Sometimes you just need a clean list of customers with their most recent order-but sorting through all the data manually ...
Auditing Data and Spreadsheets
Learn how to audit spreadsheets for hidden risks and secure your sensitive data. In this Data Survival Skills session, Robin demonstrates how seemingly simple Excel files can contain more than meets the eye-from hidden sheets ...
Visualizing data sets in Outlook
Learn how to transform datasets into Outlook calendar visuals. Date-related data is easier to understand when it's shown on a calendar instead of a spreadsheet. In this Data Survival Skills session, Robin demonstrates how to ...
Building Data Sets inside of Outlook
Learn how to build reusable data sets directly inside Outlook. Outlook is often seen as just an email tool, but it's packed with data and powerful scheduling features. In this Data Survival Skills session, Robin ...
Mapping Data into Other Software Tools
Data everywhere - and plenty of places to put it. A key to data survival and well data quality is being able to leverage data for other places without rekeying it in. Learn core concepts ...
Designing relationships for databases
Learn how to design structured database relationships that turn messy information into reliable insights. In this Data Survival Skills session, Robin shows how Explore California organizes potential tour data by moving from unstructured notes and ...
Creating a SharePoint back end from a database
Discover how to turn a long list of event details into a clean, organized schedule in seconds. In this Data Survival Skills session, Robin shows how to use Power Query's Pivot Column to transform agenda ...
Creating tables and joins to recode data
Discover how to clean up messy text fields and make your data consistent. In this Data Survival Skills session, Robin teaches how to create a control table and use joins to recode survey data with ...
Merging data and building basic calculations into a data set
Learn how to combine multiple data sources into a single, analysis-ready dataset with Power BI. In this Data Survival Skills session, Robin demonstrates how to merge customer order records, cohort data, and loyalty program participation ...
Adding data leveraging cross joins
Learn how to quickly assign full schedules to all employees using SQL cross joins. In this Data Survival Skills session, Robin demonstrates how to create two tables-one for employees and one for schedules-and use a ...
Using date functions to create follow up data
Learn how to save hours on recurring tasks using date functions in Excel. In this Data Survival Skills session, Robin demonstrates how Explore California streamlined their customer survey process by calculating follow-up dates automatically. She ...
Build letter size for reports using Power BI Desktop
Learn how to create print-ready, state-specific reports in Power BI. Printed reports are still essential for executive meetings, but recreating dashboards for print can be time-consuming. In this Data Survival Skills session, Robin demonstrates how ...
Build paginated reports
Learn how to build paginated reports that scale with your data. Dashboards are great for visual exploration, but when you need detailed, multi-page printouts, paginated reports are essential. In this Data Survival Skills session, Robin ...
Building a brief for a data project
Learn how to create clear, actionable briefs for your data projects. Delivering data sets isn't just about sharing numbers-it's about providing context. In this Data Survival Skills session, Robin shows how to build simple data ...
Establishing a Cohort Data Set
Learn how to uncover long-term customer trends with cohort analysis. Every dataset tells a story, but sometimes the most powerful insights come from asking different questions. In this Data Survival Skills session, Robin introduces cohort ...
Adding Additional Data to Your Cohorts
Cohorts let you group customers for deeper insights-but the real power comes when you connect them to additional details. In this Data Survival Skills session, Robin shows how to enhance cohort analysis by including the ...
Leveraging the Advanced Editor in Power Query to share cleaning routines
Learn how to share and reuse your data cleaning routines with the Advanced Editor in Power Query. Cleaning data in Excel is essential, but repeating the same steps across multiple files or platforms can be ...
Creating simple data sets with basic visuals for presentations
Learn how to create simple, professional visuals from basic datasets. Sharing data isn't just about the numbers-it's about presenting them clearly and effectively. In this Data Survival Skills session, Robin demonstrates how to turn small ...
Analyzing top and bottom scenarios
Learn how to study the top and bottom of your dataset with Power BI. Full datasets are valuable, but sometimes the biggest insights come from just the highest- or lowest-performing records. In this Data Survival ...
Designing a Basic System for Data Capture
Learn how to design smarter data tables with Microsoft Copilot and SQL Server. Every successful project starts with the right structure. In this Data Survival Skills session, Robin shows how to plan out key tables ...
Use Copilot in Excel to teach you about the data
Learn how to work with public population data using Excel Copilot and Power Query. Aggregated datasets often include both state- and county-level records, which can inflate totals if left unstructured. In this Data Survival Skills ...
Use Copilot to build basic functions in Excel
Discover how to use Copilot to build and verify basic Excel functions. In this Data Survival Skills session, Robin prompts Copilot to calculate the change in county populations from 1990 to 2022 and to find ...
Use Copilot to do basic cleanup commands
Learn when to lean on Copilot vs. Power Query in Excel. In this Data Survival Skills session, Robin shows how to clean up a dataset for a quick ad hoc marketing request-removing unnecessary fields, reformatting ...
Use Copilot to see insights in your data
Discover how to use Copilot to quickly explore and understand your datasets. In this Data Survival Skills session, Robin shows how to use Power Query to remove distracting fields before diving into insights with Copilot. ...
Use Copilot in Word to build documentation about your data project
Learn how to streamline documentation and research with Microsoft Word and Copilot. Every data project needs context, whether for yourself, your team, or final presentations. In this Data Survival Skills session, Robin shows how to ...
Diagramming Data and Processes
Learn how to design user interfaces for better data entry. In this Data Survival Skills session, Robin shows how to translate data requirements into simple, effective UI mockups. Starting with a volunteer signup form, you'll ...
Basic visualization of cohort data
Learn how to clearly visualize cohort data over time. Cohort data can be complex-especially when it comes to tracking progression across grades, years, or other time-based stages. In this Data Survival Skills session, Robin demonstrates ...
Using Remove Duplicates to Create Data Sets
Learn how to turn messy order data into clean, usable datasets with Power Query's Remove Duplicates tool. In this Data Survival Skills session, Robin works with sales from Leaf & Mortar's pop-up shops, where customer ...
Adding data leveraging cross joins
Learn how to quickly assign full schedules to all employees using SQL cross joins. In this Data Survival Skills session, Robin demonstrates how to create two tables-one for employees and one for schedules-and use a ...
Using Case statements for conditional logic in SQL queries
Learn how to uncover booking trends with SQL and Excel. Every business wants to know when customers commit-are they booking last-minute or months in advance? In this Data Survival Skills session, Robin shows how to ...
Analyzing data using a matrix and conditional formats
Learn how to uncover hidden booking gaps with Power BI. Static reports often hide the story behind missing activity-weeks or days where tours never filled. In this Data Survival Skills session, Robin shows how to ...
Using Different Pivot Formats to Share Stories
Learn how to enhance storytelling with pivot and matrix visualizations in Power BI. In this Data Survival Skills session, Robin demonstrates how dashboards provide only a surface view, while pivot structures enable deeper exploration of ...
Perform basic analysis on Datasets
Learn how to perform basic analysis on datasets. Every dataset has a story-and it often starts with the mean, median, and mode. In this Data Survival Skills session, Robin shows how to use Power Query ...
Using analysis commands built into Popular Tools
Discover the power of built-in analysis tools. Most modern data tools-including Excel-come with analysis features that can uncover insights quickly, no coding required. In this Data Survival Skills session, Robin demonstrates how to clean and ...
Basic dates analysis
Learn how to reveal hidden gaps in your booking data. Traditional reports often miss the story behind no activity-days and weeks where bookings never happened. In this Data Survival Skills session, Robin shows how to ...
Building paginated reports in Power BI
Learn how to build paginated reports that scale with your data. Dashboards are great for visual exploration, but when you need detailed, multi-page printouts, paginated reports are essential. In this Data Survival Skills session, Robin ...
Edit visual interactions
Learn how to make dashboards truly interactive and user-friendly. Dashboards are only valuable if users can explore data without confusion or error. In this Data Survival Skills session, Robin demonstrates how to set up visuals ...
Using Joins and Update Queries to Create Markers in the Data
Learn how to keep orders organized and accurate with joins and update queries. In this Data Survival Skills session, Robin works with Leaf & Mortar's orders from both stores and pop-up shops. Starting with a ...
Building Date Tables in Power BI/Power Query
Learn how to streamline time-based analysis by building a reusable date table in Power Query. In this Data Survival Skills session, Robin starts with a blank query and uses a custom function to generate a ...
Using Make Tables to normalize a denormalized data set
Discover how to turn messy spreadsheets into an organized, normalized database with Microsoft Access. In this Data Survival Skills session, Robin takes Leaf & Mortar's order and customer list and shows how to make it ...
Using Append queries to combine spreadsheets
Learn how to combine multiple spreadsheets into a single dataset with append queries in Power Query. In this Data Survival Skills session, Robin demonstrates how to bring in individual Excel files-such as order data from ...
Using Union Queries to Bring Together Data Sets in SQL
Learn how to turn messy order data into clean, usable datasets with Power Query's Remove Duplicates tool. In this Data Survival Skills session, Robin works with sales from Leaf & Mortar's pop-up shops, where customer ...
Build conditional functions to make data
Learn how to create powerful insights from imperfect data by building conditional logic in Power BI. In this Data Survival Skills session, Robin demonstrates how to merge CSV and Excel sources, bringing together wholesale costs ...
Cleaning data from a folder of files in Power BI
Learn how to clean and combine data from multiple files in Power BI. Managing monthly files can be tedious-but Power Query's From Folder command makes it seamless. In this Data Survival Skills session, Robin demonstrates ...
Duplicate vs Reference in Power Query
Learn how to choose the right approach when reusing datasets in Power Query. In this Data Survival Skills session, Robin explains the difference between duplicating and referencing queries-and when to use each. By walking through ...
Cleaning data from a PDF in Power BI
Discover how to turn static PDF files into interactive, analyzable data. In this Data Survival Skills session, Robin shows how to use Power Query in Power BI to import tables from vendor PDFs and clean ...
Using Unpivot to build data sets from Survey Results
Learn how to transform messy survey data into powerful insights. In this Data Survival Skills session, Robin shows how to use Unpivot in Power Query to restructure wide-format survey results into clean, record-based tables. By ...
Creating aggregated datasets
Learn how to turn detailed records into aggregated datasets that reveal insights without exposing sensitive information. In this Data Survival Skills session, Robin demonstrates how to group customer credit limits in Excel and then scale ...
Using Functions to Mask Data
Learn how to protect sensitive information in reports and presentations by masking data in Excel. In this Data Survival Skills session, Robin demonstrates practical strategies for hiding confidential details-like credit card numbers-while keeping data useful ...
Model or Merge- and what’s the difference?
Learn how to choose between merging data into a single dataset or modeling data across multiple related tables in Power BI. In this Data Survival Skills session, Robin demonstrates how to import customer, orders, plants, ...
Normalizing data to achieve a data design
Learn how to break down combined datasets into clean, structured tables. In this Data Survival Skills session, Robin shows how to normalize data by separating information on plants, vendors, orders, and customers. By identifying relationships ...
Working with full outer joins
Discover how to compare and combine two lists of information to get the full picture. In this Data Survival Skills session, you'll watch Robin use Excel's Power Query to analyze top-selling products and top-requested products ...
Using anti joins to search for data
Learn how to search for specific data across multiple lists of information. In this Data Survival Skills session, Robin loads customer records and website leads into Power Query, lines up the fields, and merges the ...
Joining data with common data between two unrelated data sets
Unlock the secret to joining two completely unrelated datasets by finding and creating common data. In this Data Survival Skills video, Robin shows how to build a unique key field in Power Query-using techniques like ...
Creating unique identifiers between two data sets
Learn how to seamlessly connect datasets-even when key fields are missing. In this Data Survival Skills session, Robin walks through importing, cleaning, and merging data in Power Query, showing how to create unique identifiers and ...
Data Fundamentals Unpacked
Join Robin Hunt, Bill Shander and Gini Von Courter every month to unpack data fundamentals and skills of the trade.
Building The Data Workforce – Helen Wall

Helen Wall is a data analytics and business analysis expert. Helen is skilled in data analysis—querying, analyzing, and modeling data to gain insights—and creating visualizations that illustrate metrics, to help businesses make informed decisions. In ...
Building The Data Workforce – Bill Shander

Bill Shander is an information designer, helping clients turn their data into compelling visual and often interactive experiences. He teaches data storytelling, information design and data visualization on LinkedIn Learning, at the University of Vermont, ...
Building The Data Workforce – Oz du Soleil

Oz du Soleil, Microsoft Excel MVP, Author, YouTube Creator By day, Oz uses Excel to battle Crap Data, blazing trails through data's dusty badlands. By night, he's a collector of kaleidoscopes. With a fiery passion ...
Building The Data Workforce – Gini von Courter

Gini von Courter has taught computer classes on Microsoft Office for 20+ years and has authored 30+ books. Gini has been providing computer classes and seminars on Microsoft Office and related products for more than ...
Building The Data Workforce – Robin Hunt

Robin Hunt is a developer and educator focused on process development, data management, and custom workflows. Robin loves to inspire people to "think something new" and has a passion for people and data. She actively ...
DFU: What languages should you learn for Data

***For best viewing experience log in to LinkedIn*** June 13, 2023 - Helen Wall returns for this fantastic talk about languages, coding, and data. The discussion covers problem solving, what is and is not programming, ...
DFU: When Data Gets Scary
***For best viewing experience log in to LinkedIn*** October 25, 2022 - Oz du Soleil is on the program for this episode! He's the perfect guest for an episode about SCARY data- what scares the ...
DFU: Plan Your Learning Path
***For best viewing experience log in to LinkedIn*** September 13, 2022 - On this episode of Data Fundamentals Unpacked we go over learning. Whether you're at the beginning of considering starting your path to being ...
DFU: Bias

July 13, 2022 - We are excited to have expert Stacey A. Gordon join us for a discussion on bias, how we can learn more on the topic, and ways to avoid it in our ...
DFU: Common Sense
***For best viewing experience log in to LinkedIn*** April 13, 2022 - Common sense is a fun topic. Do we need it in data, or is book sense enough? How do we get it, how ...
DFU: Data Ethics
***For best viewing experience log in to LinkedIn*** March 10, 2022 - Doug Rose joins us this week for a fascinating talk about ethics in data. What rules do we have, what rules should we ...
DFU: Math and Statistics

***For best viewing experience log in to LinkedIn*** February 24, 2022 - Today we figure out our relationships with math, our own barriers to getting comfortable with numbers, and times when we've had to wrestle ...
DFU: Seasonality

***For best viewing experience log in to LinkedIn*** December 2, 2021 - Seasonality is the topic at hand, and everyone brings great personal insights to what seasonality is, why it's important to consider, and how ...
DFU: Tools Agnosticism
***For best viewing experience log in to LinkedIn*** September 16, 2021 - In this episode we took a look at how people use (and don't use!) tools and how data professionals adapt to changing situations. ...
DFU: Big Data
***For best viewing experience log in to LinkedIn*** July 15, 2021 - Big Data is this episode's topic. It's a hot topic, but what's smoke and what's fire? Helen Wall joins the team as we ...
DFU: Uncertainty
***For best viewing experience log in to LinkedIn*** June 17, 2021 - On this episode of Data Fundamentals unpacked we have a wide-ranging talk on uncertainty in data and uncertainty in the wider world. We ...
DFU: Data Literacy
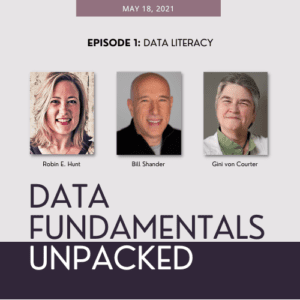
***For best viewing experience log in to LinkedIn*** May 18, 2021 - On this episode of Data Fundamentals unpacked we have a lively discussion of what data literacy means to different people in different contexts ...
Want Us to Speak at Your Event?
Are you looking for a speaker for your next event who can discuss data? Want to find out why the ability to work with data is a necessary skill for all organizations in a modern digital age? We would love to talk to you!
Need Help With Your Data?
ThinkData creates customized training solutions for companies of all sizes, tailored to what your team needs most.